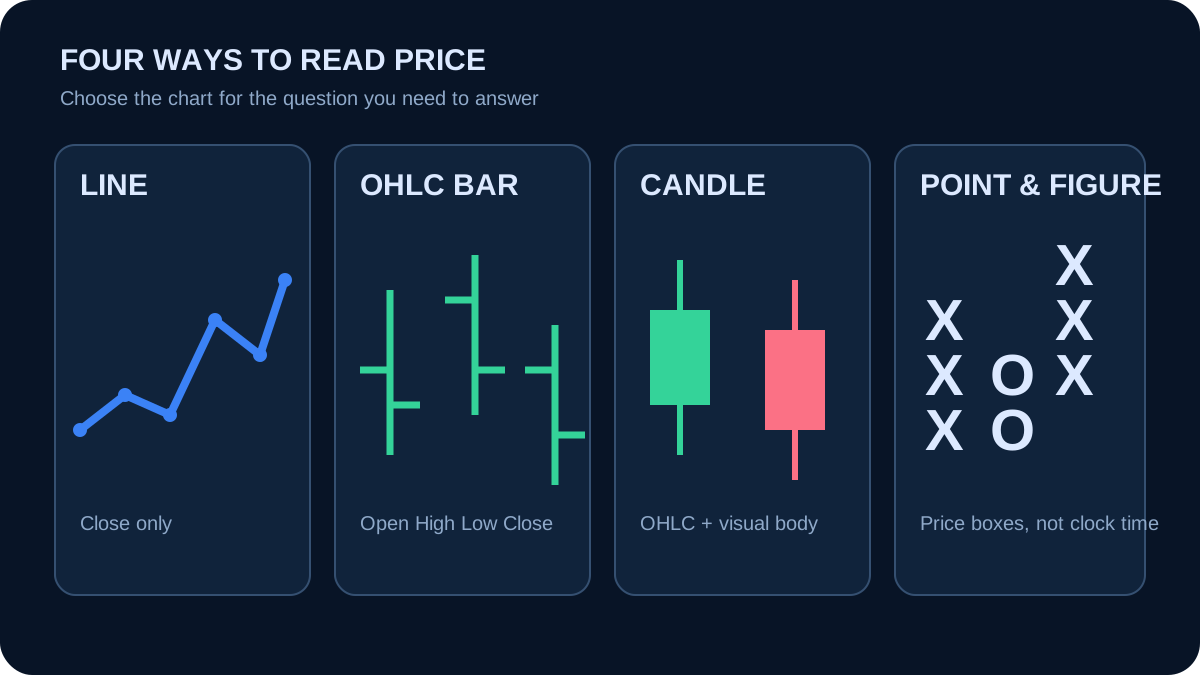
1. Before reading candles, identify what the chart displays
A chart compresses price observations into a visual form. Each chart type retains different information, so it answers different questions. Always verify the symbol, feed, timeframe, and chart type before interpreting a shape.
1.1 Line chart — clear direction, hidden intraperiod path
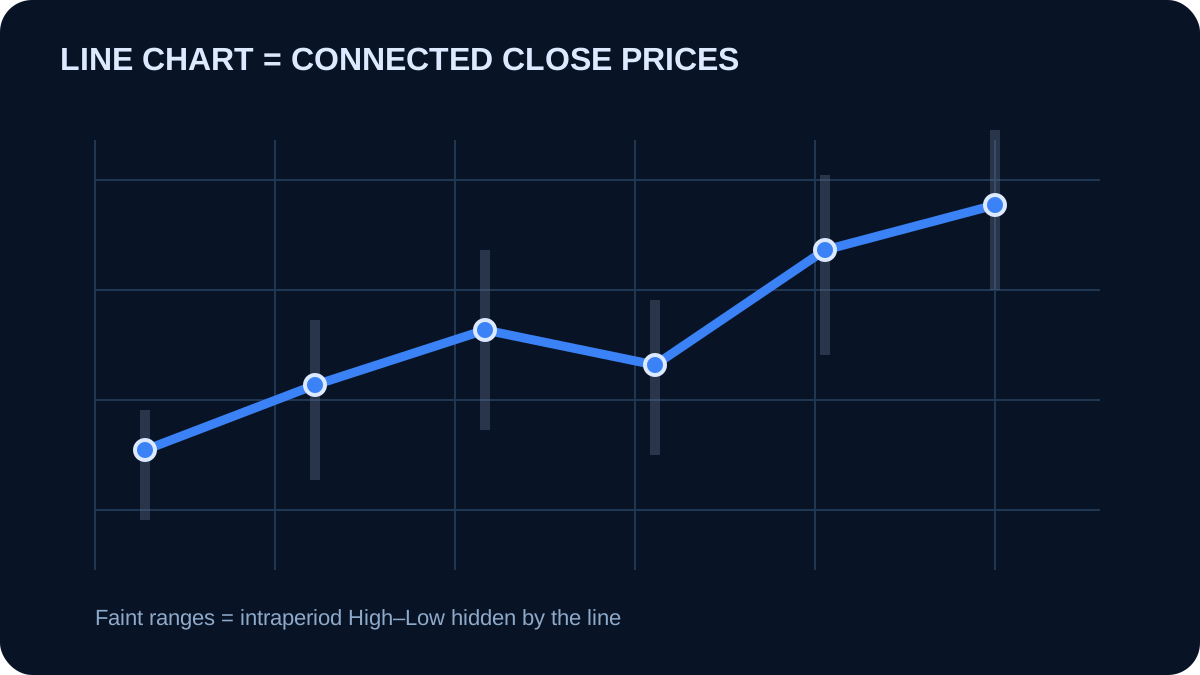
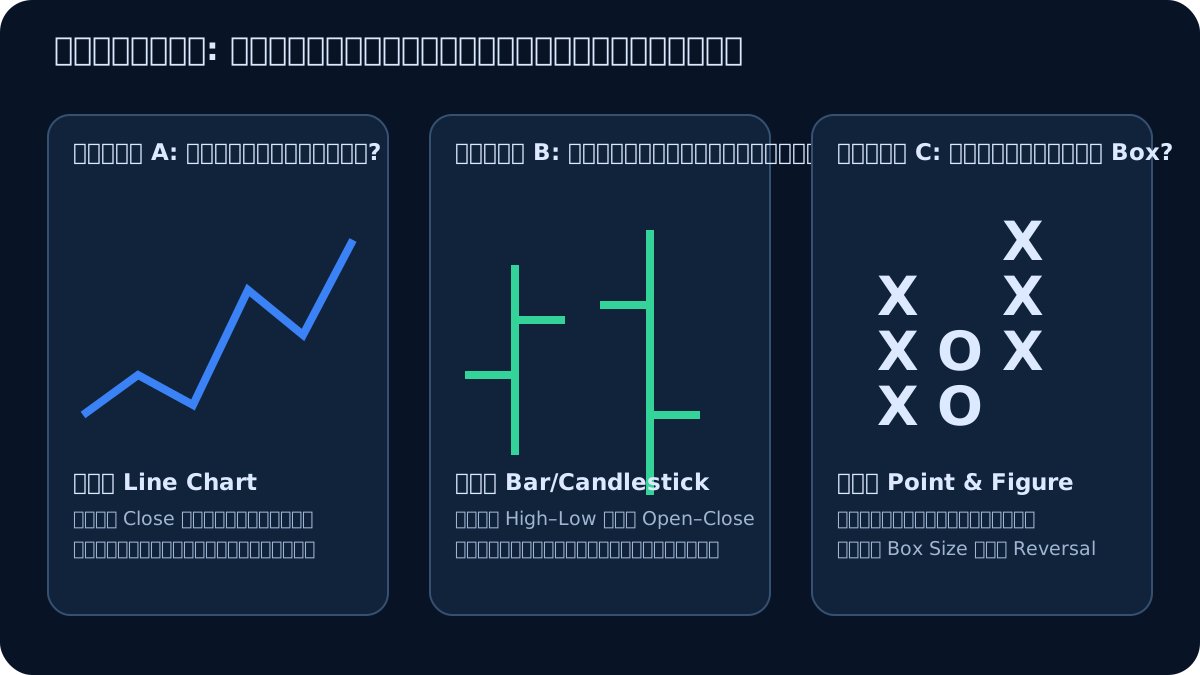
A standard line chart connects the close of each interval. It is useful for trend and closing acceptance, but hides the high, low, wick, and the path taken before the close.
1.2 Bar chart — OHLC without candle bodies
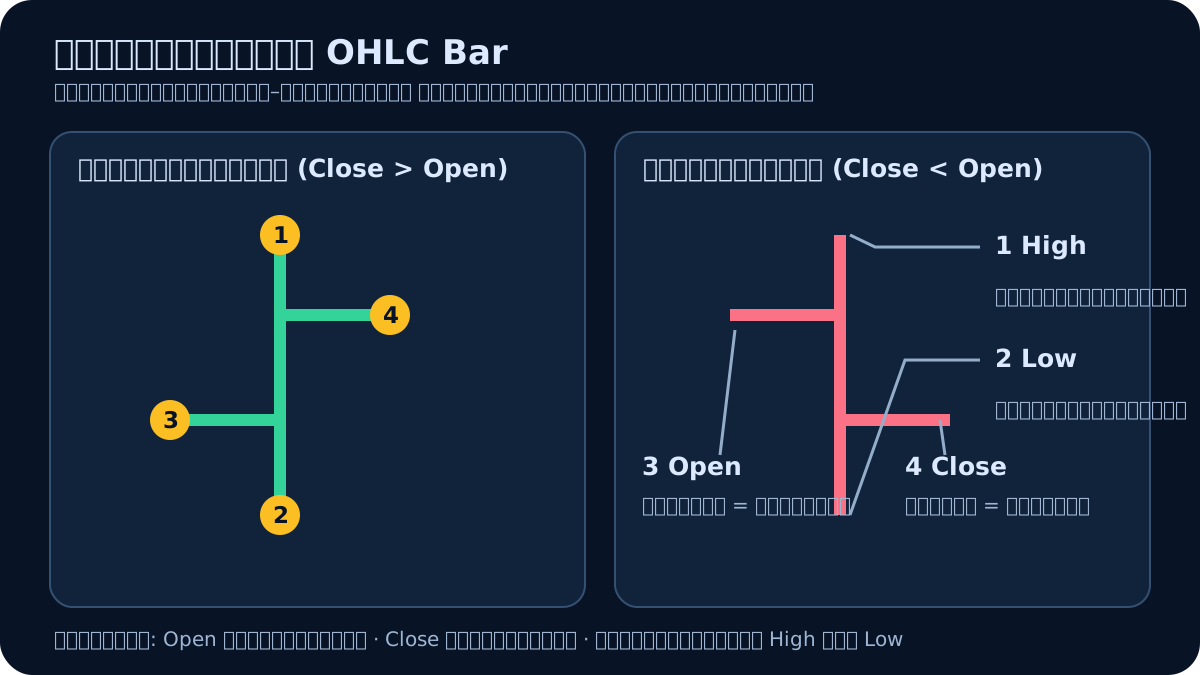
An OHLC bar runs vertically from low to high. The left tick is open and the right tick is close. It contains the same four price fields as a candlestick while placing less visual emphasis on body color.
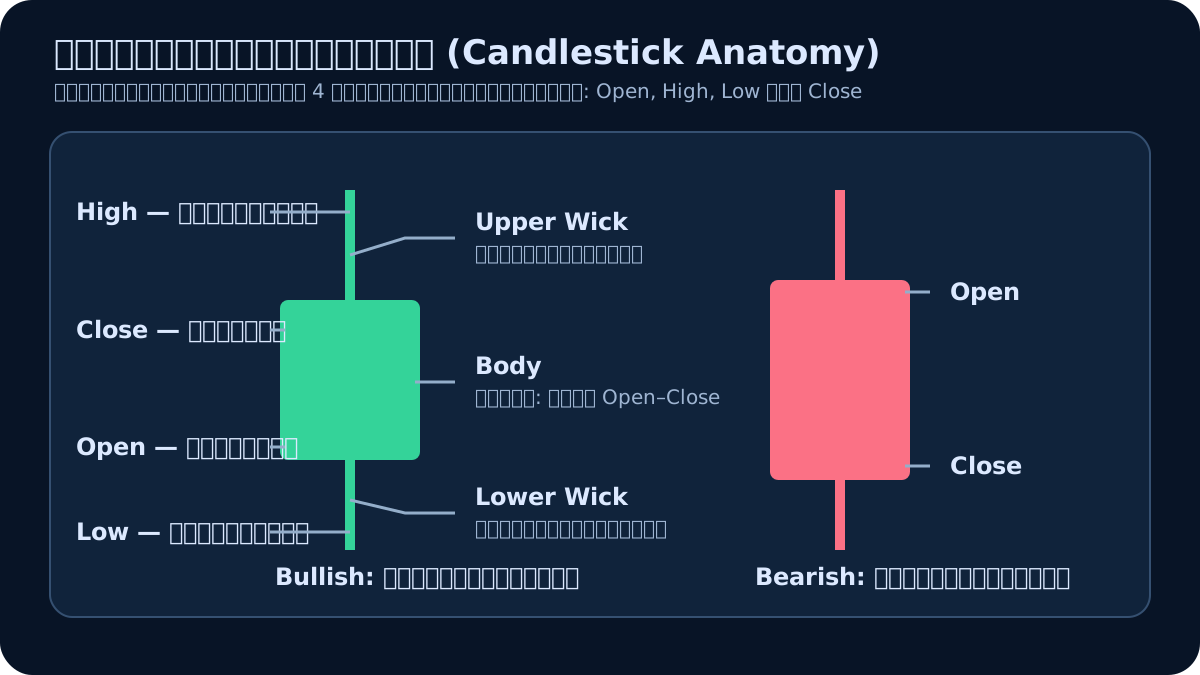
1.3 Candlestick chart — OHLC, body, and wick
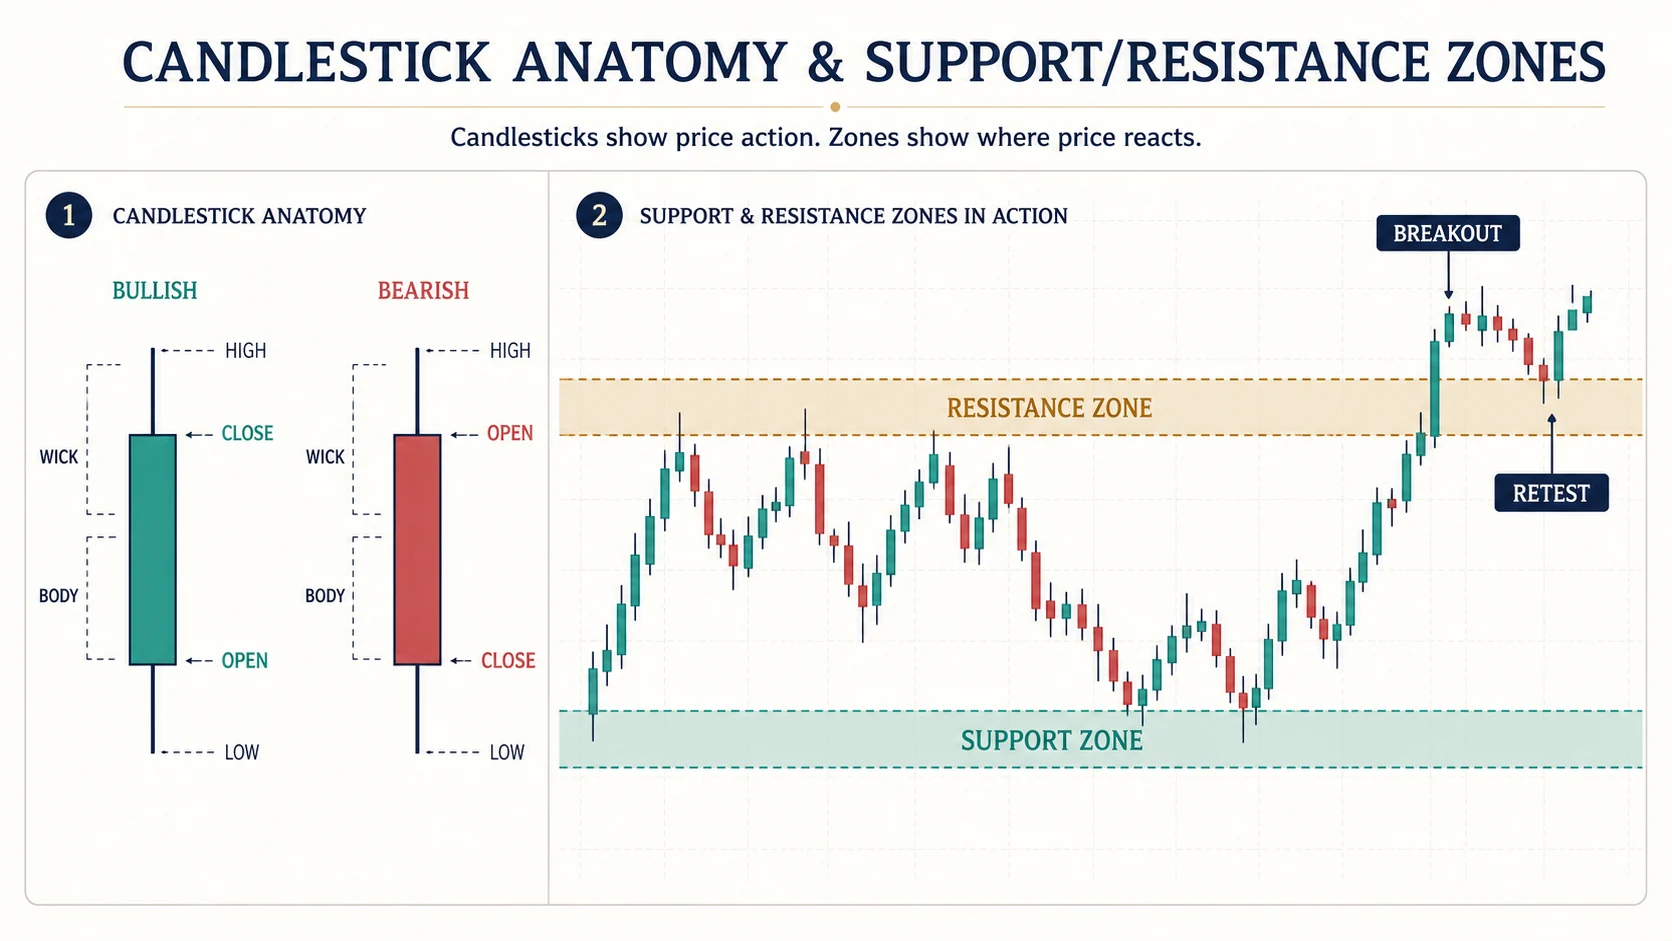
The body spans open to close; wicks extend to high and low. A long body describes a large open-close distance, not participant identity. A long wick says price visited and left an area before the close, but OHLC does not reveal whether the high or low occurred first.
1.4 Point & Figure or X/O chart
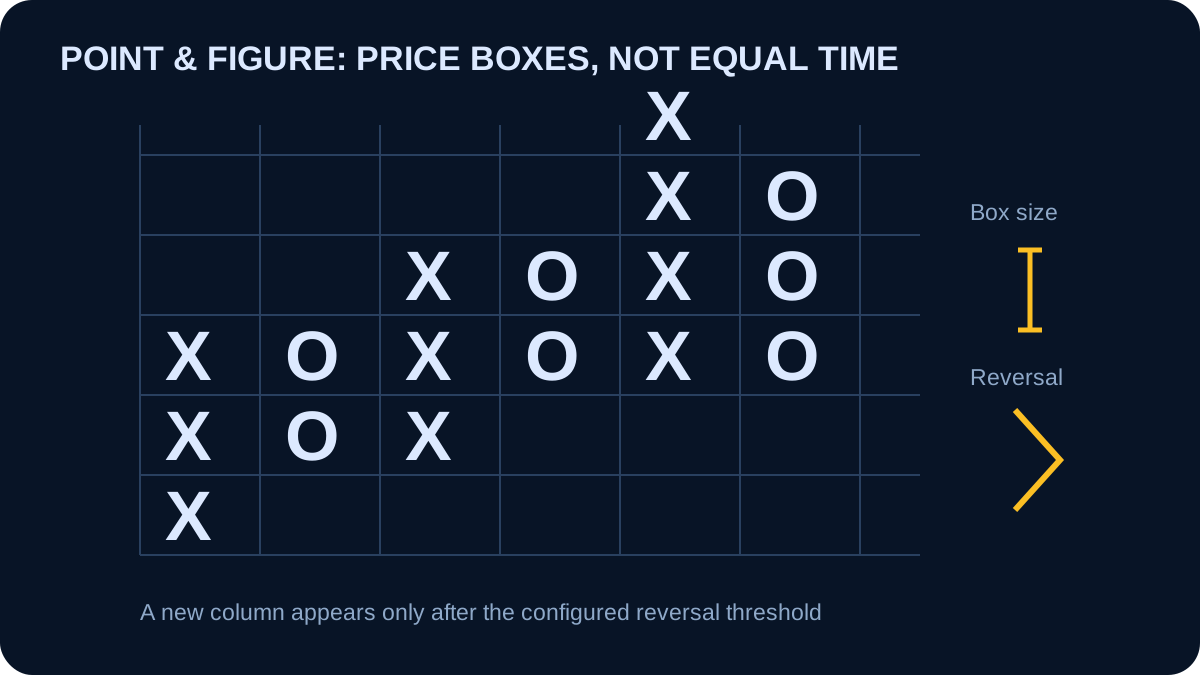
Point & Figure plots rising boxes as X and falling boxes as O. Box size controls each price step and reversal size controls when a new column begins. The horizontal axis is not evenly spaced clock time, so P&F emphasizes price movement while omitting OHLC paths and elapsed duration.
1.5 Worked example: choose a chart for the question
Use a line chart to answer whether closes are generally rising, falling, or ranging. Switch to bars or candles when the question concerns high-low range, the open-close relationship, or rejection within an interval. Use Point & Figure only when a box-and-reversal view is intentional. No chart is universally best; each discards information.
2. X/Y axes and timeframe
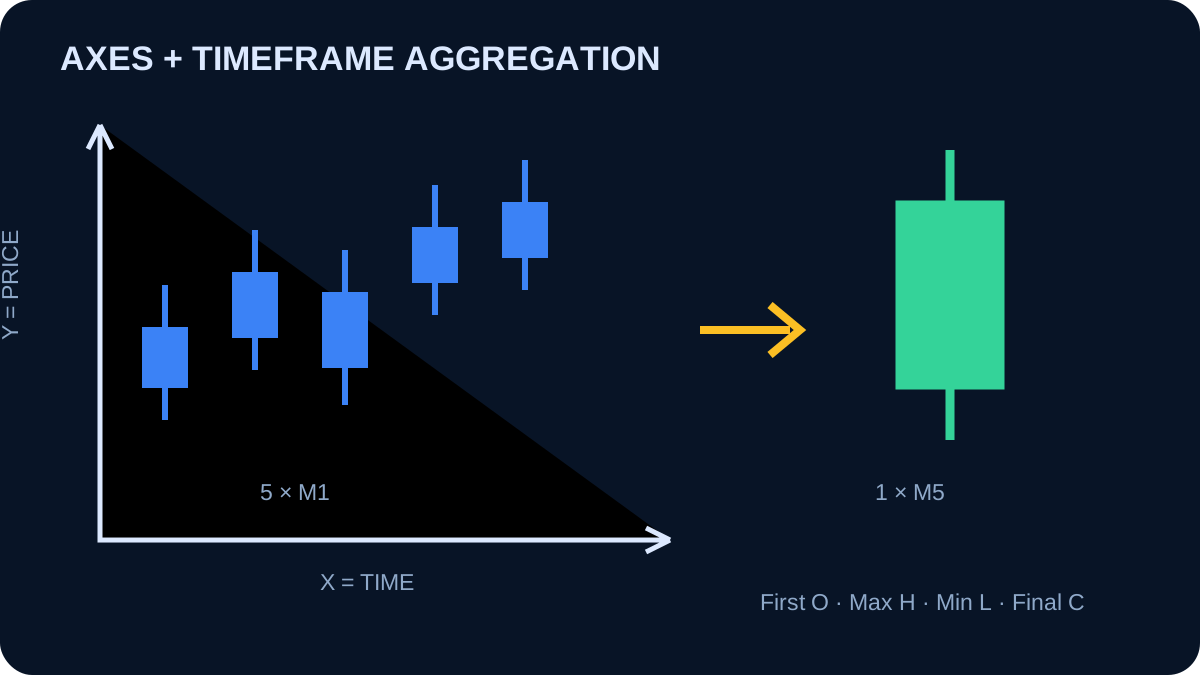
The X-axis orders time and the Y-axis shows price, not profit. A timeframe is the interval summarized by one bar. A live bar is incomplete and may continue changing. Higher-timeframe OHLC is aggregated from lower intervals, which hides the internal sequence.
2.1 Beginner multi-timeframe example
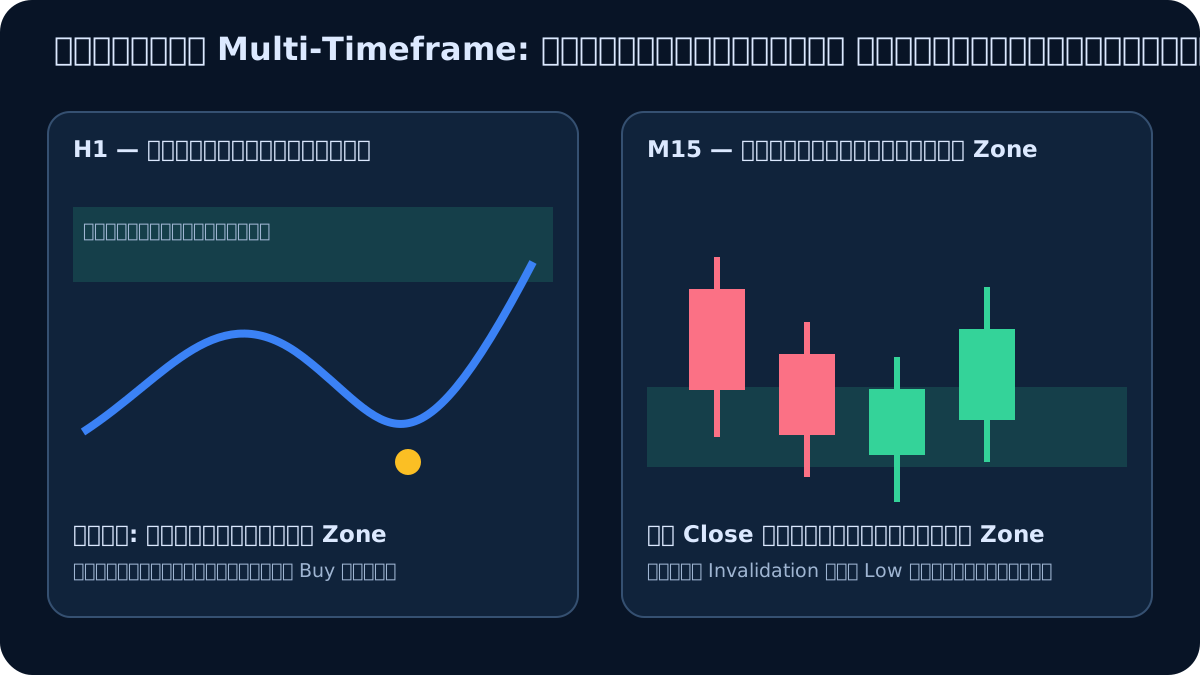
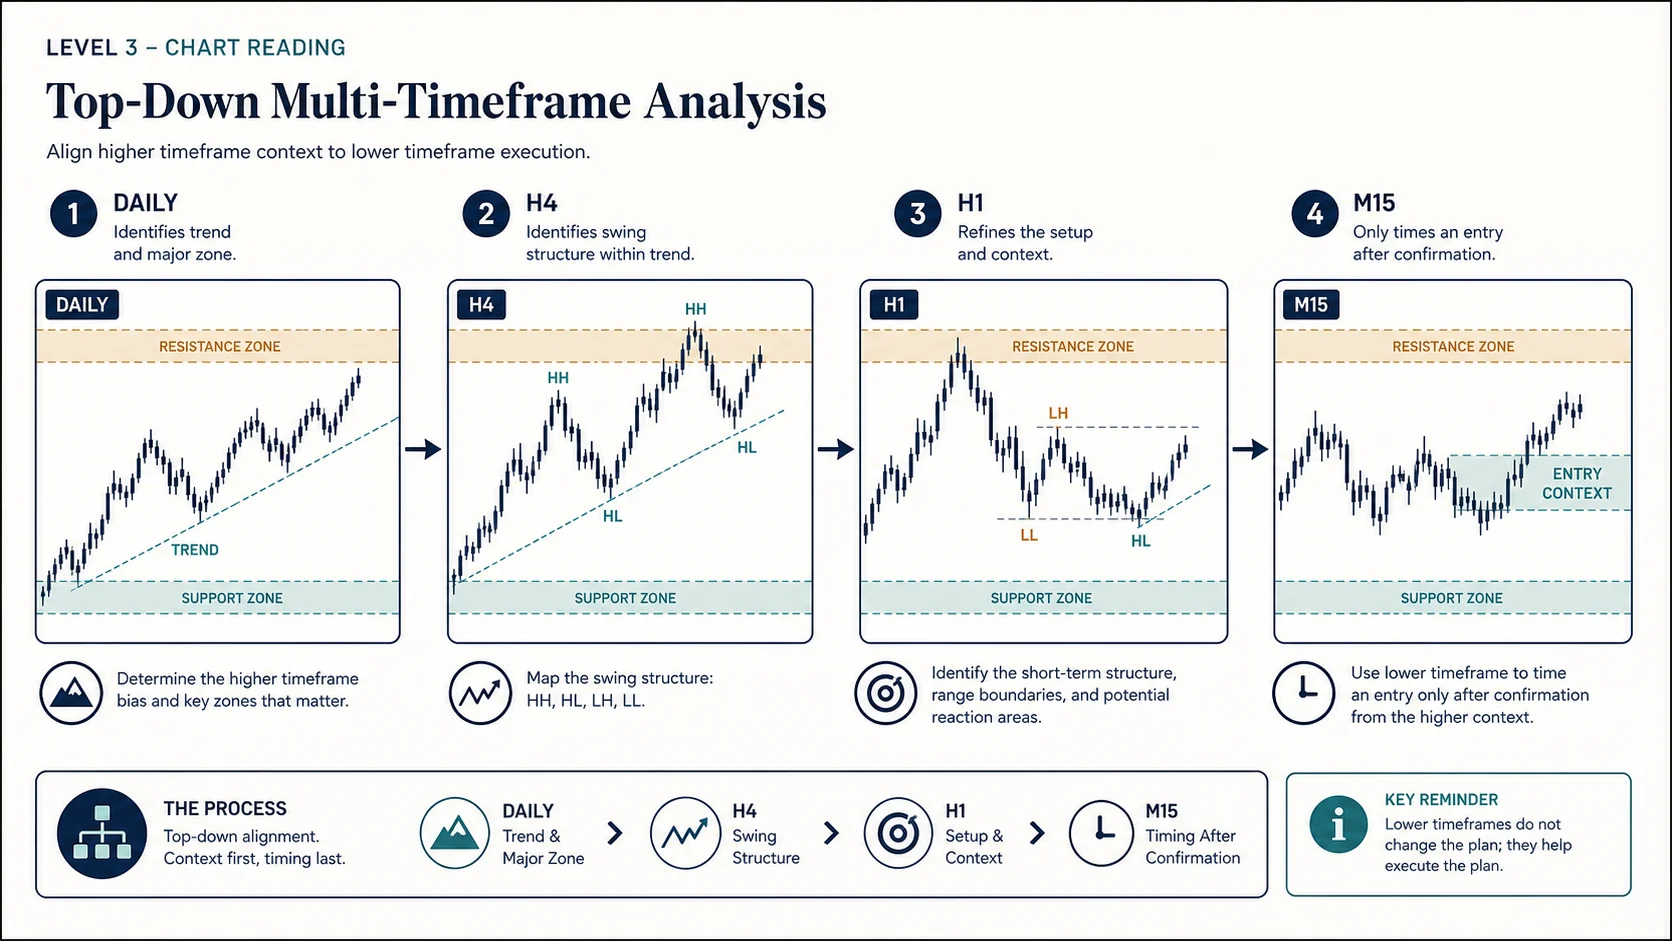
Mark a higher-timeframe zone on H1 first, then inspect M15 only after price reaches it. Wait for the M15 bar to close, define invalidation beneath or above the relevant structure, and calculate risk before considering a demo order. The lower timeframe supplies detail; it must not be used to move the pre-marked zone until the original idea appears correct.
3. Pip, point, tick, and cash value
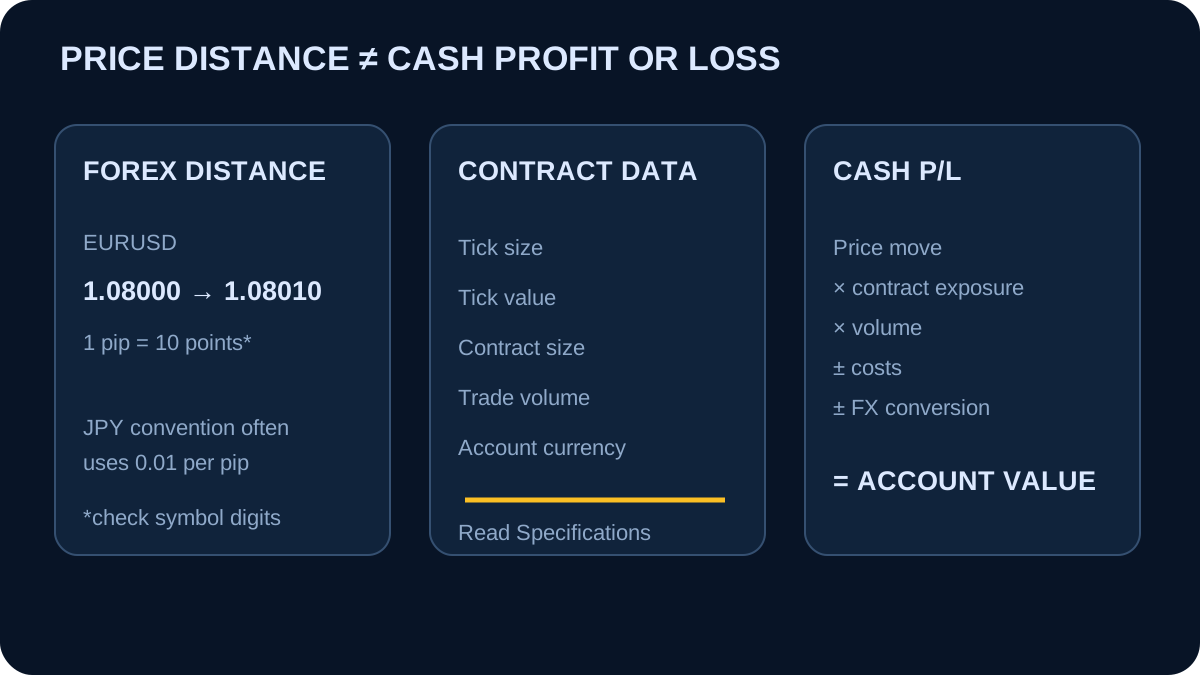
Conventionally, one pip is 0.0001 for many FX pairs and 0.01 for many JPY pairs, but symbol specifications control the actual quote. A MetaTrader point is the smallest quoted increment; a five-digit FX quote commonly has ten points per pip. Tick size is the minimum configured price movement and tick value is its cash value for a stated contract size.
Non-FX price movement should not be equated directly with dollar P/L. A USD-quoted gold price can move 1.00 while account P/L depends on contract size, volume, tick size/value, and currency conversion. Read the symbol specification first.
3.1 Worked pip and point calculation
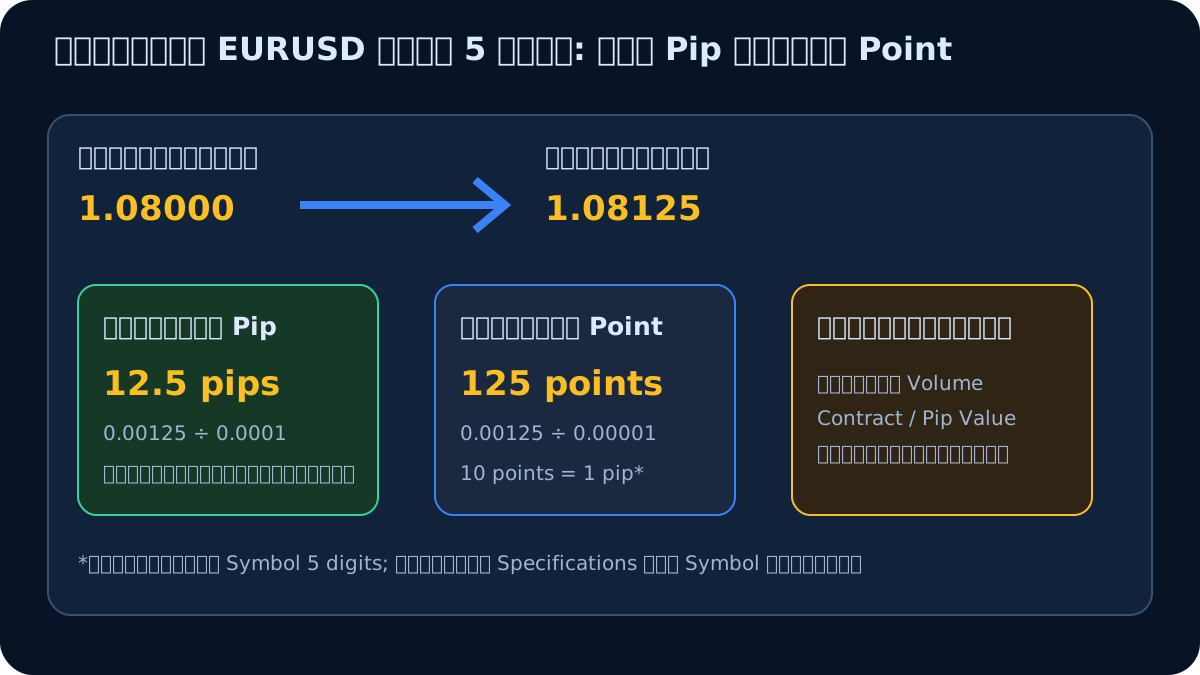
For a five-digit EURUSD quote moving from 1.08000 to 1.08125, the price difference is 0.00125. Dividing by 0.0001 produces 12.5 pips; dividing by the 0.00001 point produces 125 points. Neither number is cash P/L until the platform-reported pip/tick value, volume, contract specification, costs, and account currency are applied.
4. Japanese candlestick analysis — context before names
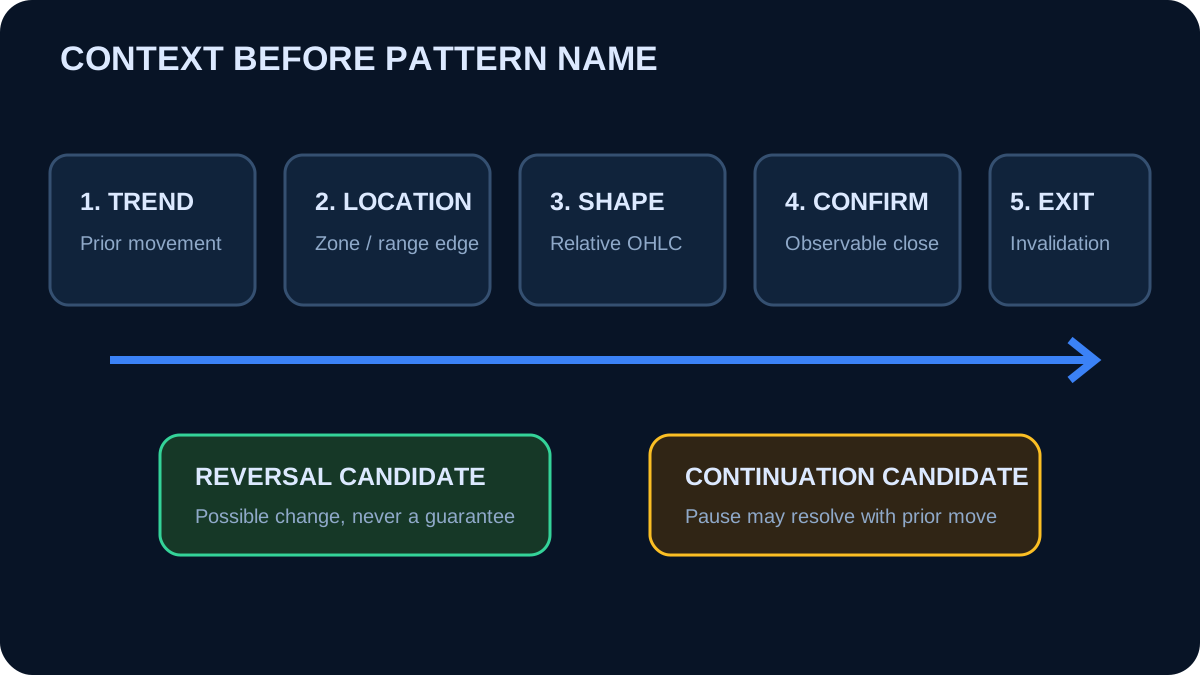
Candlestick patterns describe relationships among OHLC bars; they are not automatic trade signals. Reversal means a possible change in control, not a guarantee. Continuation means a pause that may resolve with the prior move. Location, prior movement, relative size, confirmation, and invalidation must be defined first.
4.1 One-candle reversal candidates
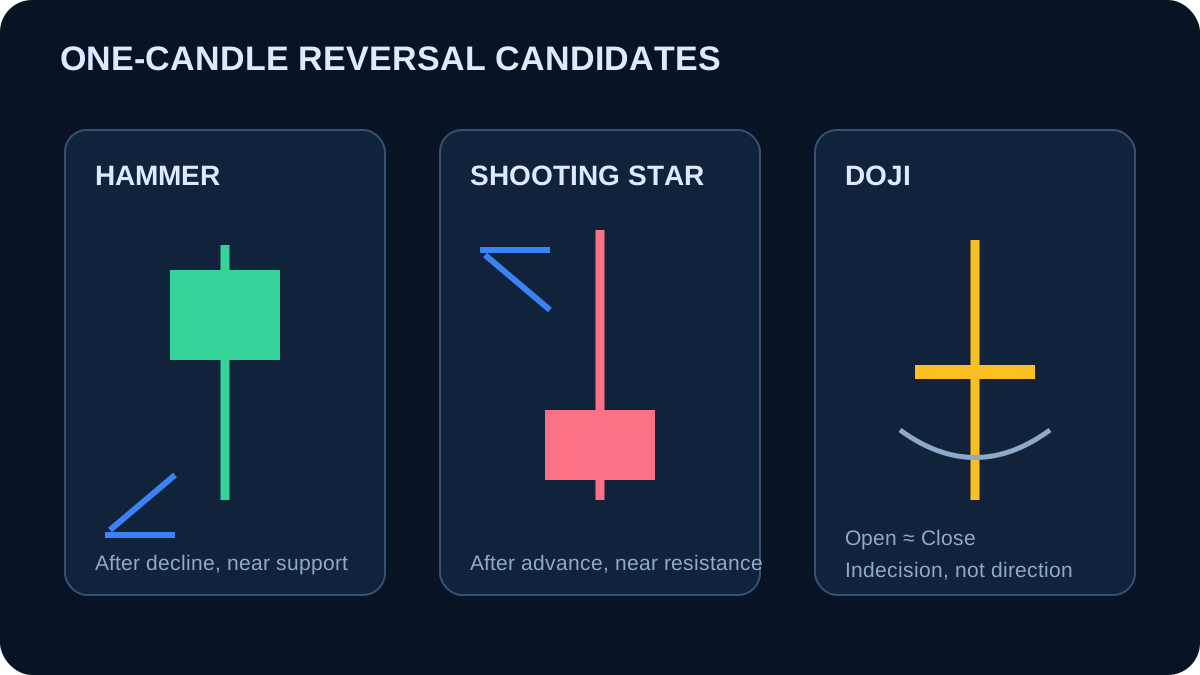
A hammer has a small upper body and long lower wick after a decline; a shooting star has a long upper wick after an advance. A doji closes near its open and represents balance or indecision, not an independent directional forecast.
4.2 Two-candle reversal candidates
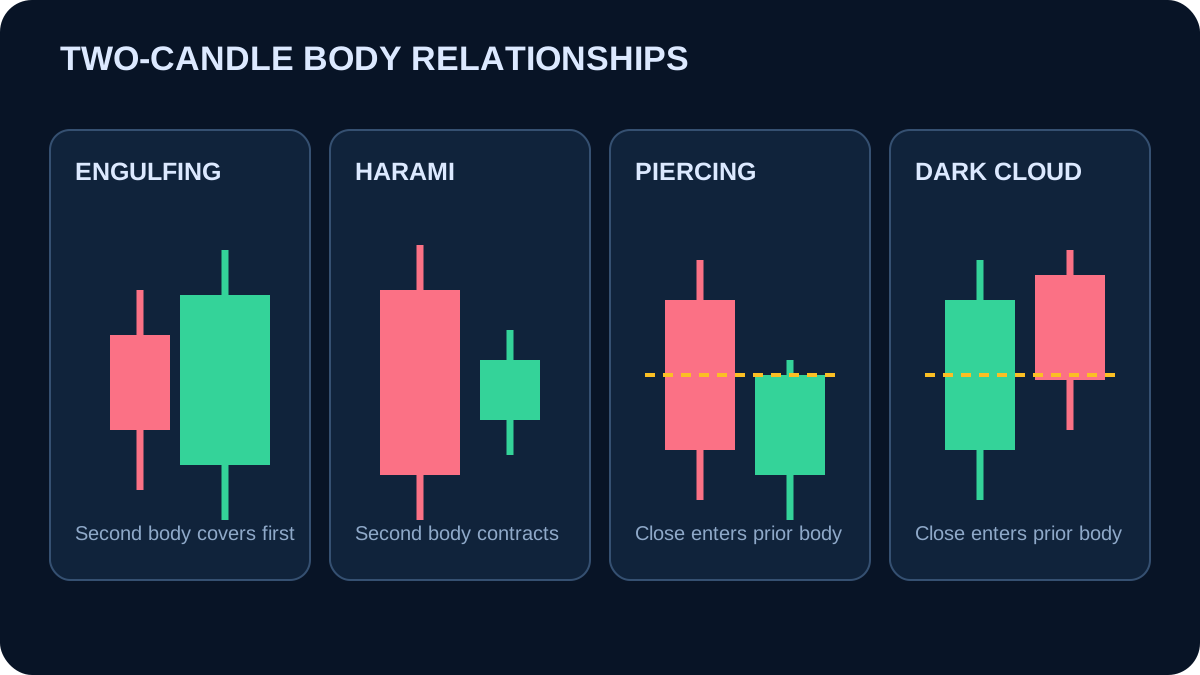
Engulfing compares two bodies, Harami places a smaller body inside the prior body, and Piercing/Dark Cloud compare how deeply the second close enters the first body. FX may lack stock-like session gaps, so any adapted definition must be fixed before testing.
4.3 Three-candle reversal candidates
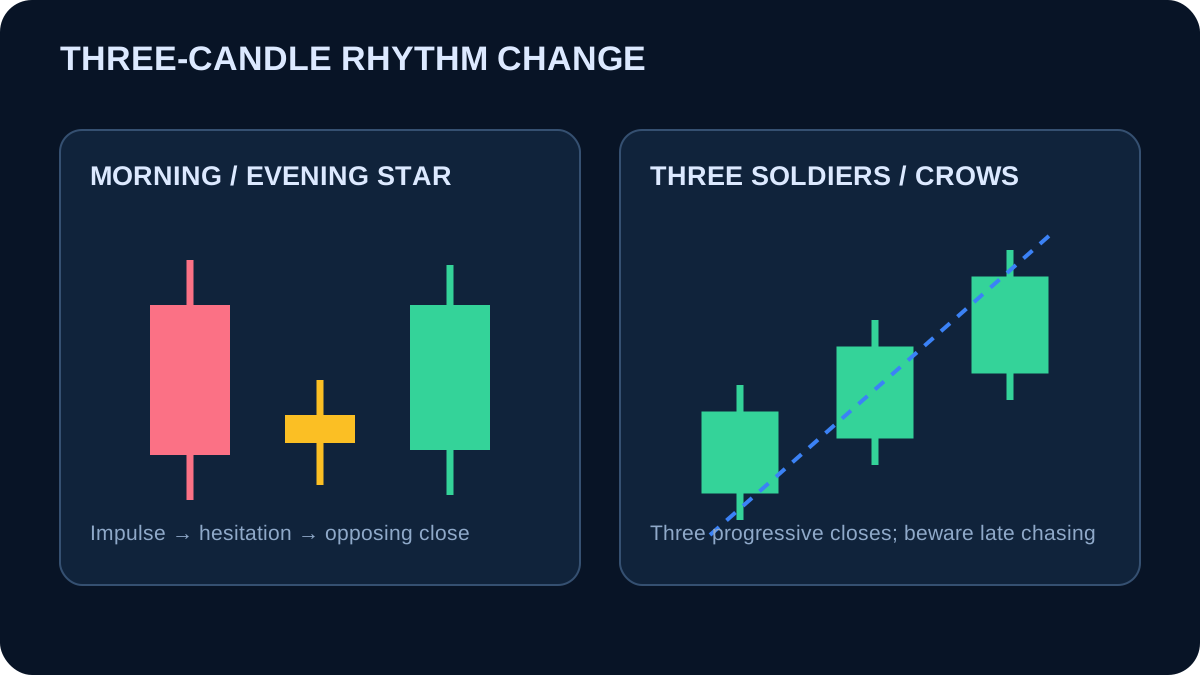
Morning/Evening Star sequences move from impulse to hesitation to opposing confirmation. Three Soldiers/Crows show three directional closes, but late appearances can indicate chasing rather than an early reversal. Define body and overlap thresholds before reviewing outcomes.
4.4 Continuation patterns and order flow
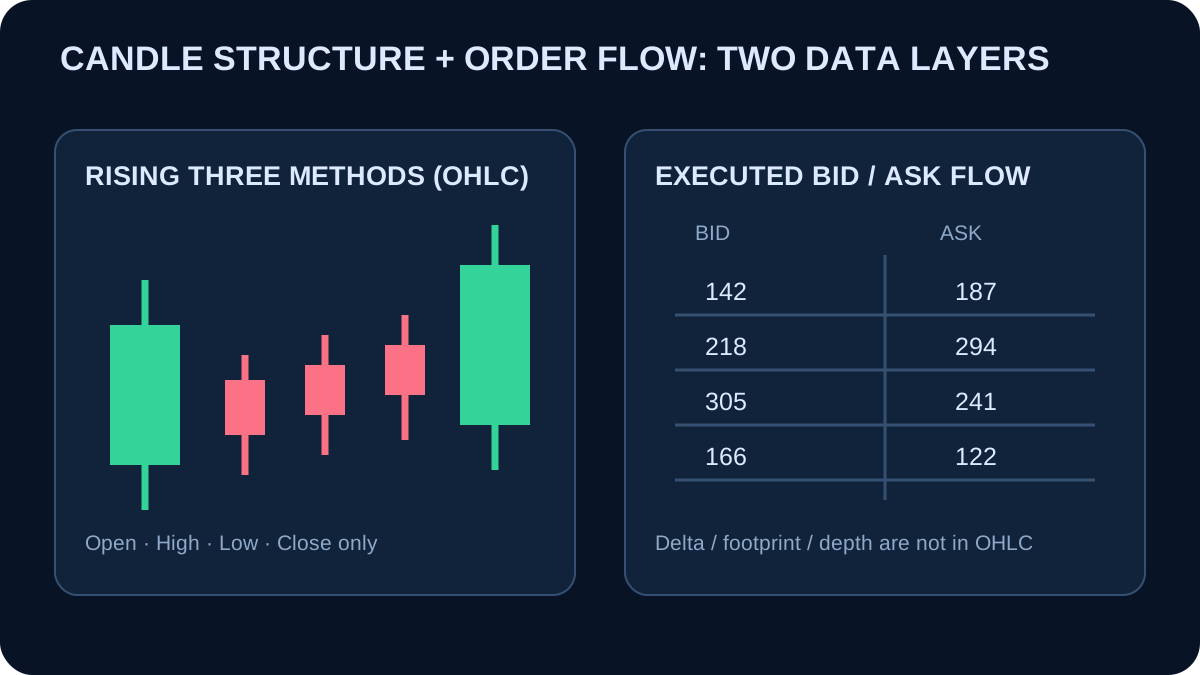
Rising/Falling Three Methods use an impulse bar, a contained pause, and continuation confirmation. Candlestick literature names fewer continuation than reversal formations, but that does not prove either class is more accurate.
Practitioners may combine continuation structure with executed bid/ask volume, delta, footprint, or depth. This combines distinct layers: OHLC candles are not order flow and cannot identify participant intent. Order-flow research supports the information content of flow, not the accuracy of a named candle pattern.
4.5 Worked pattern example at a support zone
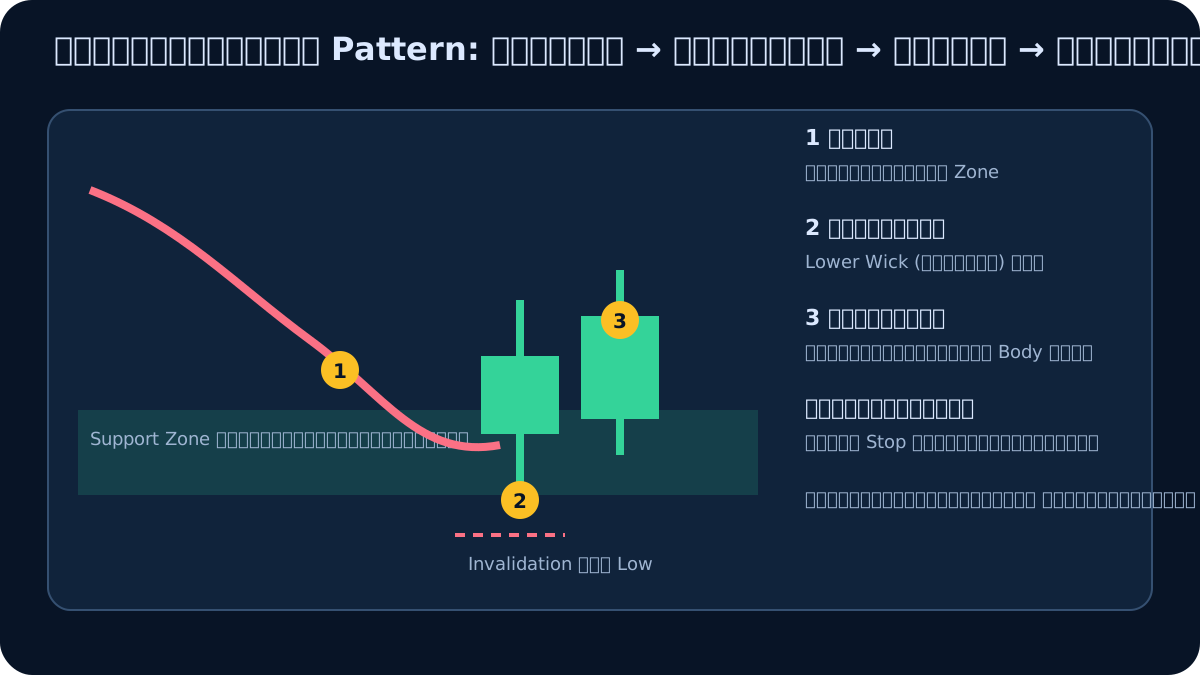
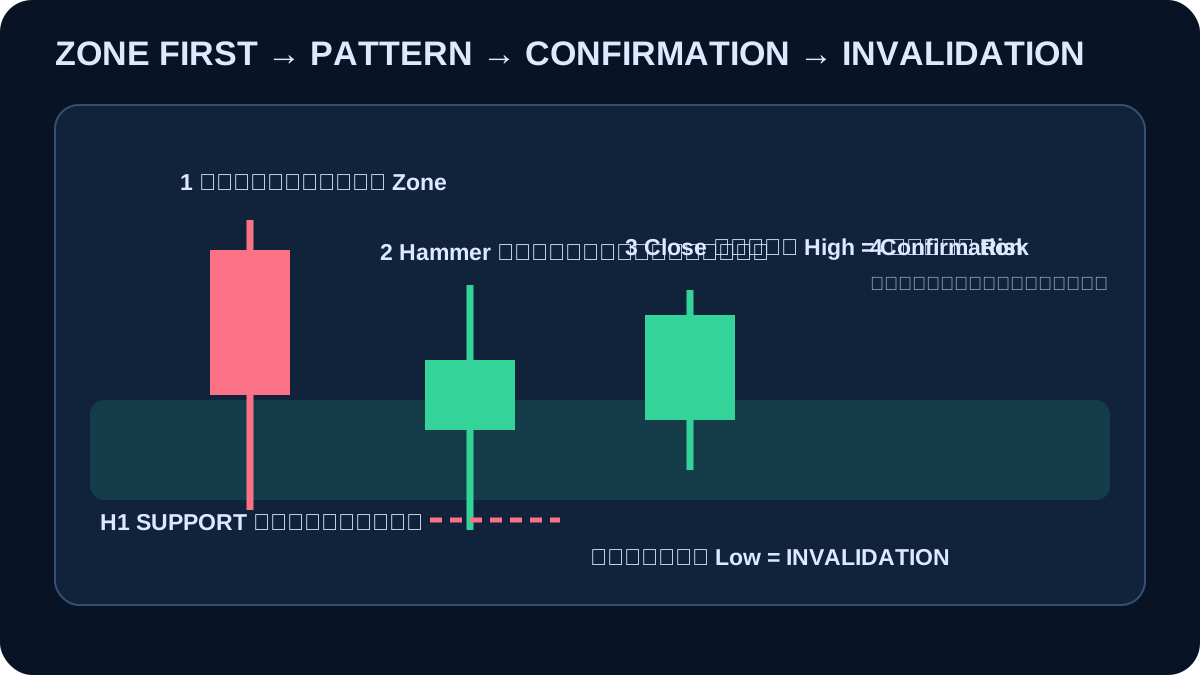
Assume an H1 support zone was marked before price arrived. On M15, a hammer closes back above the zone after its lower wick penetrates it. Do not treat the shape as an immediate buy: wait for the chosen confirmation rule, place invalidation below the structural low, and calculate volume from the planned cash risk. A close below the zone cancels the scenario instead of justifying a moved zone.
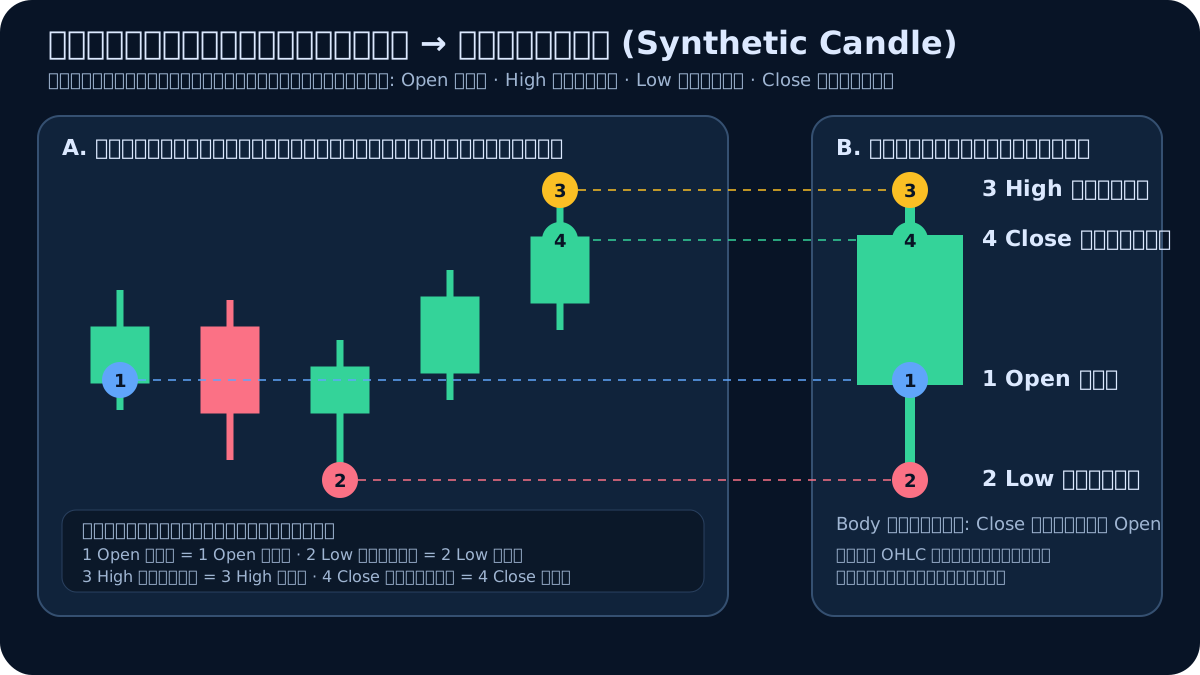
5. Combining several candles into a synthetic candle
Use the first open, maximum high, minimum low, and final close. This is the same aggregation principle used for higher timeframes. A noisy sequence can collapse into a hammer- or doji-like summary, which can clarify a range but hides event order, repeated tests, gaps, and volume distribution. Fix the aggregation window in advance to avoid hindsight selection.
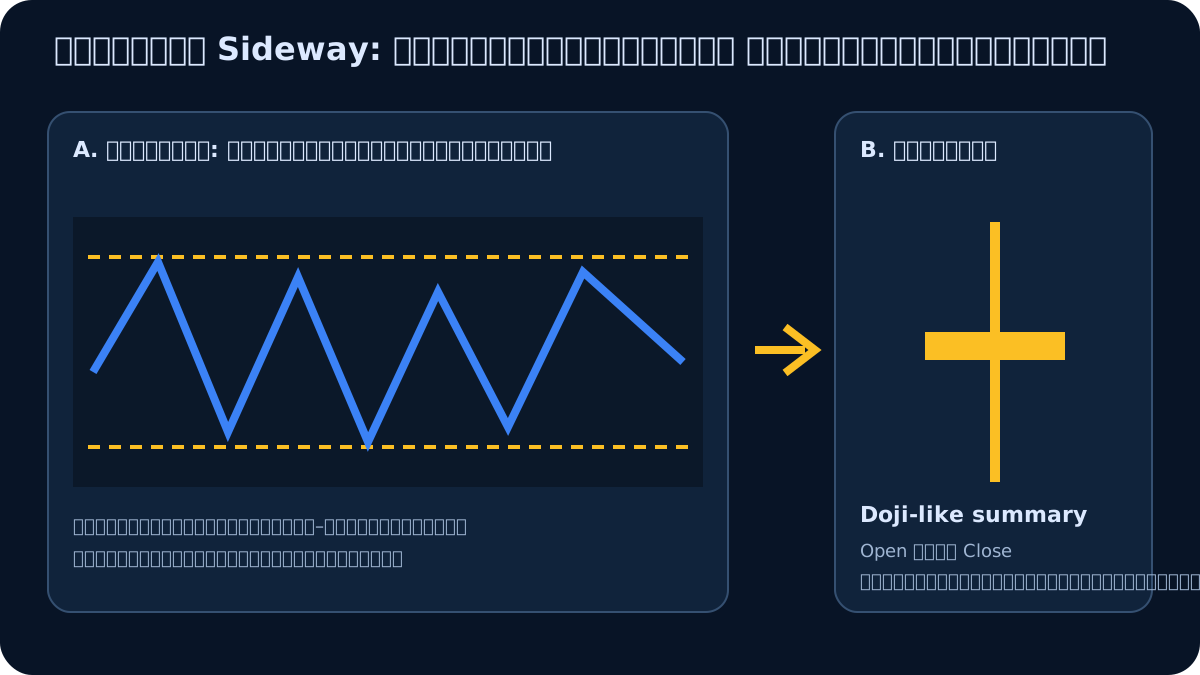
5.1 Sideways aggregation example and limitation
A range may test both boundaries repeatedly and finish near its first open. Aggregating it can produce a doji-like candle with long wicks, conveniently summarizing balance. The result hides how many tests occurred, which boundary came first, and whether a false break occurred. Use the aggregate for summary and the lower-level bars for sequence; never adjust the window repeatedly to manufacture a preferred shape.
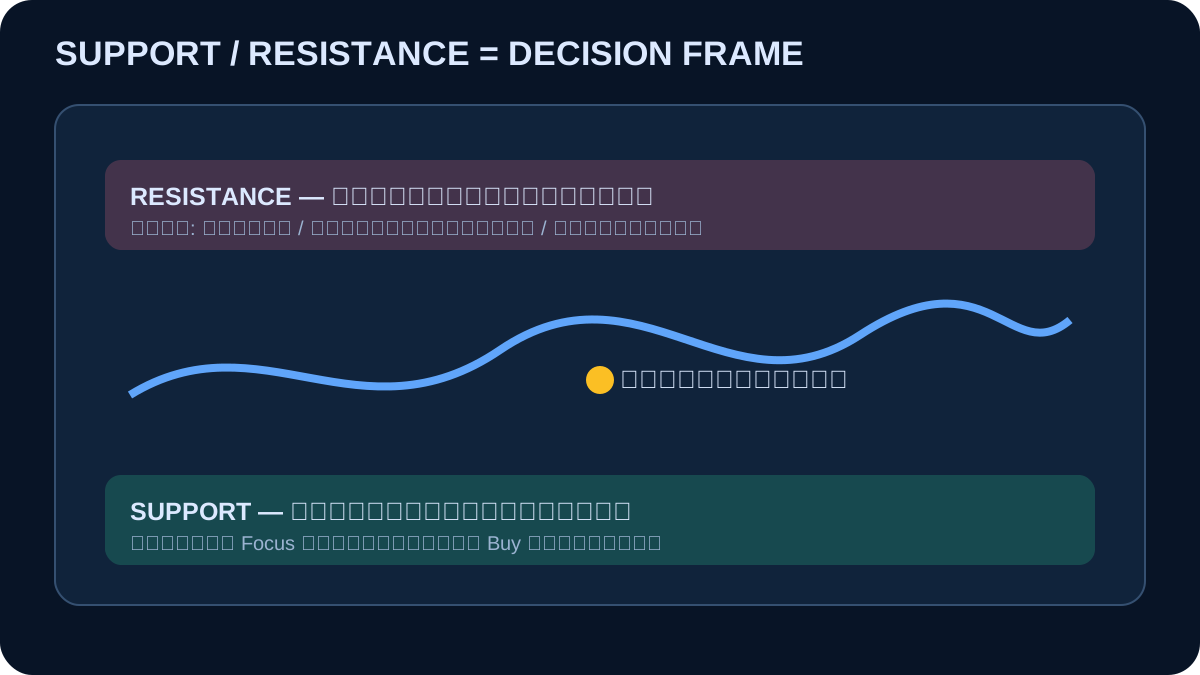
6. Support and resistance are decision frames, not price walls
6.1 Definition
Relative to current price, support is a lower level or area where the analyst prepares to observe whether a decline slows, stops, or reverses. Resistance is an upper area where an advance may slow, stop, or reverse. These are focus areas for waiting, doing nothing, invalidating a scenario, or applying a tested rule—not predictions that price must turn. Draw zones rather than one-pixel lines to accommodate feed differences, spreads, volatility, and wicks.
6.2 Psychological round numbers
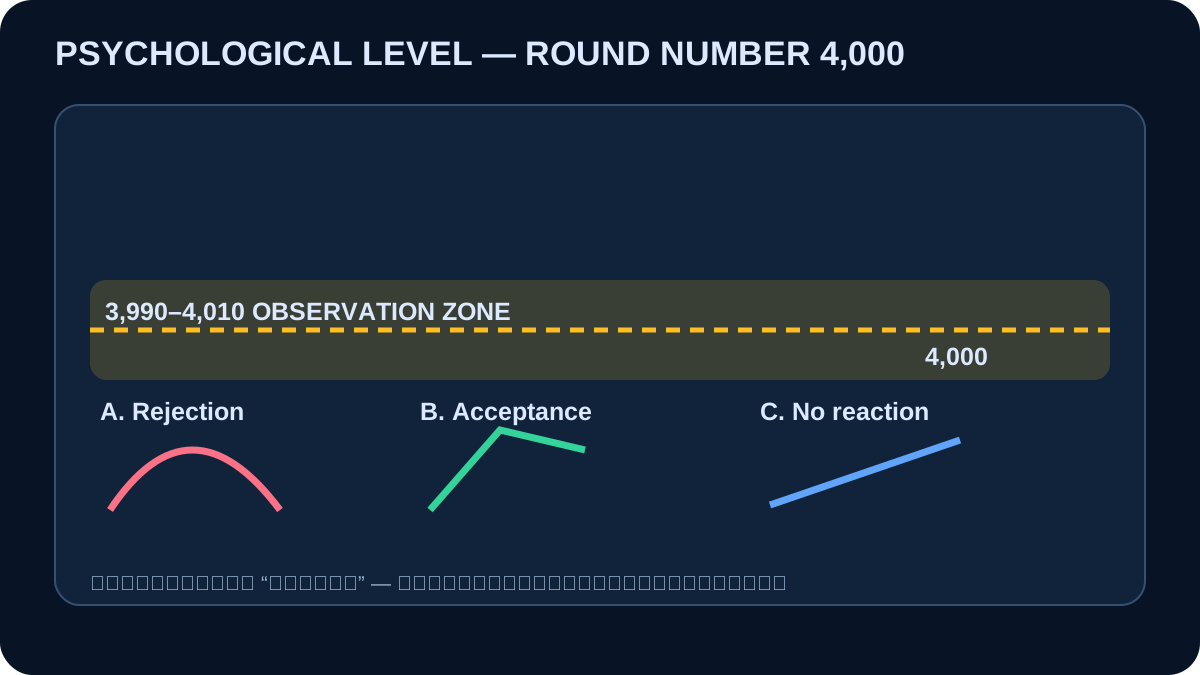
Round values such as gold 4,000 or EURUSD 1.1000 are easy to see, remember, and communicate, so attention may cluster nearby. Treat a band around the number as a hypothesis. Observe rejection, acceptance, or no meaningful reaction rather than assuming the round number must work.
6.3 Price clustering
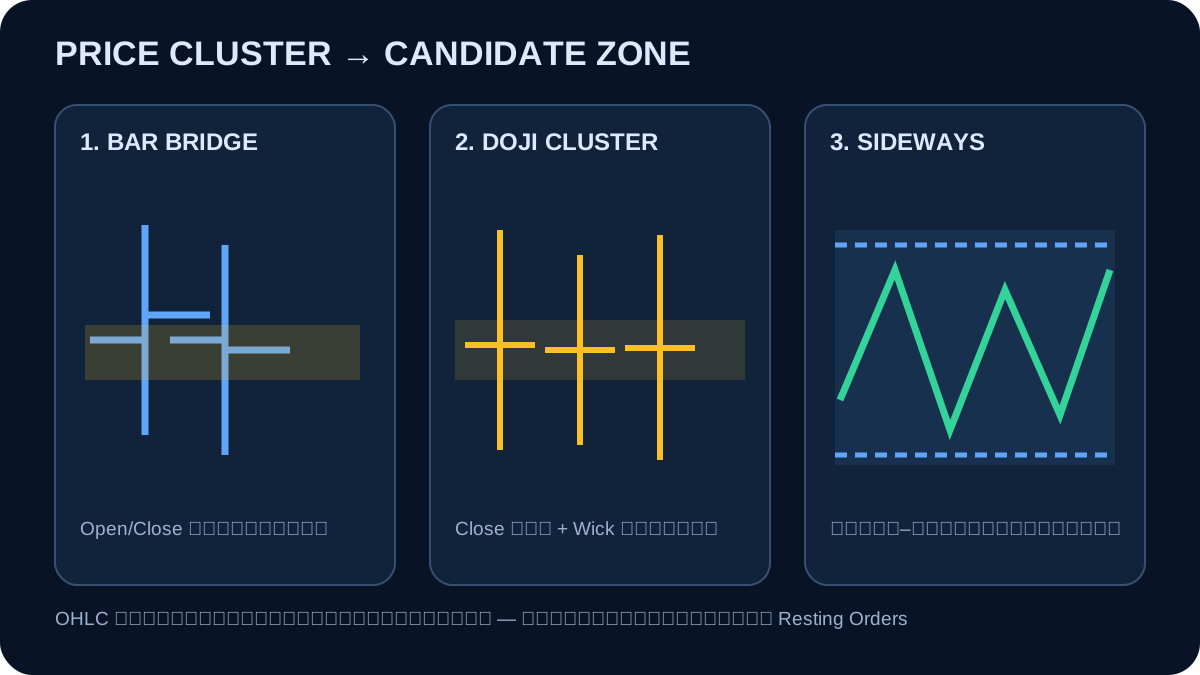
Repeated OHLC-bar bridges, adjacent dojis, clustered closes, and sideways boundaries can define candidate zones. OHLC reveals price-and-time clustering, not actual resting orders. Tick volume, executed volume, and order-flow claims require their own data.
6.4 Trend lines and Fibonacci
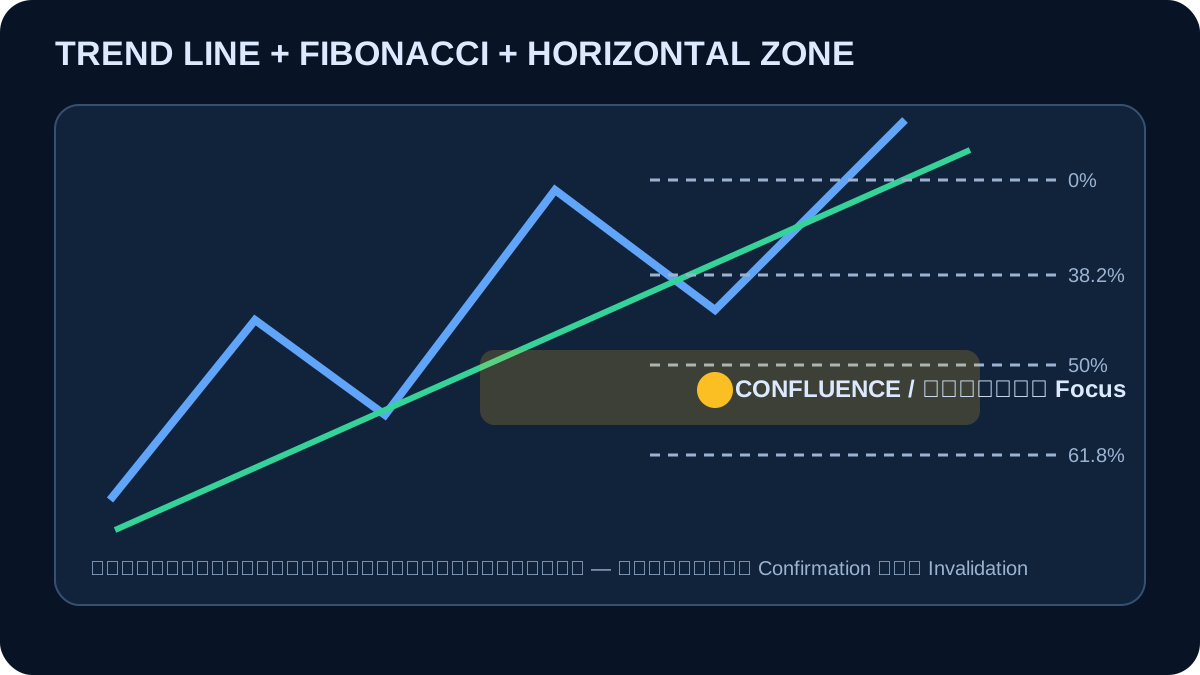
A trend line connects predefined swing lows or highs and forms sloped support or resistance. Fibonacci retracement maps proportions of a predefined swing. Both organize observation; neither physically causes a reversal. Confluence with a horizontal zone can narrow focus but still needs confirmation and invalidation.
6.5 Structure, Elliott Wave, BOS, and CHoCH
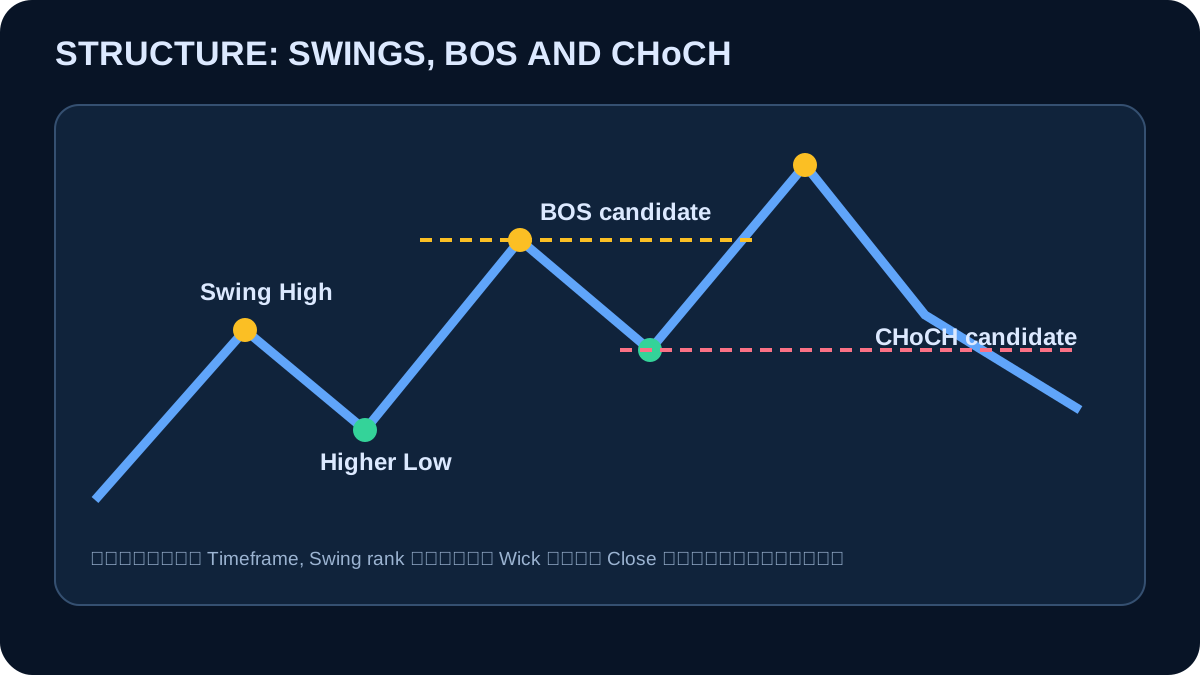
Swing highs and lows provide direct structural levels. Elliott Wave is interpretive, so keep alternate counts and invalidation visible. In Smart Money Concepts, BOS commonly describes a break in the trend direction, while CHoCH describes a break of an opposing swing that may warn of change. Definitions vary between practitioners; predefine wick versus close, swing rank, and timeframe.
7. Applying support and resistance
7.1 Role reversal
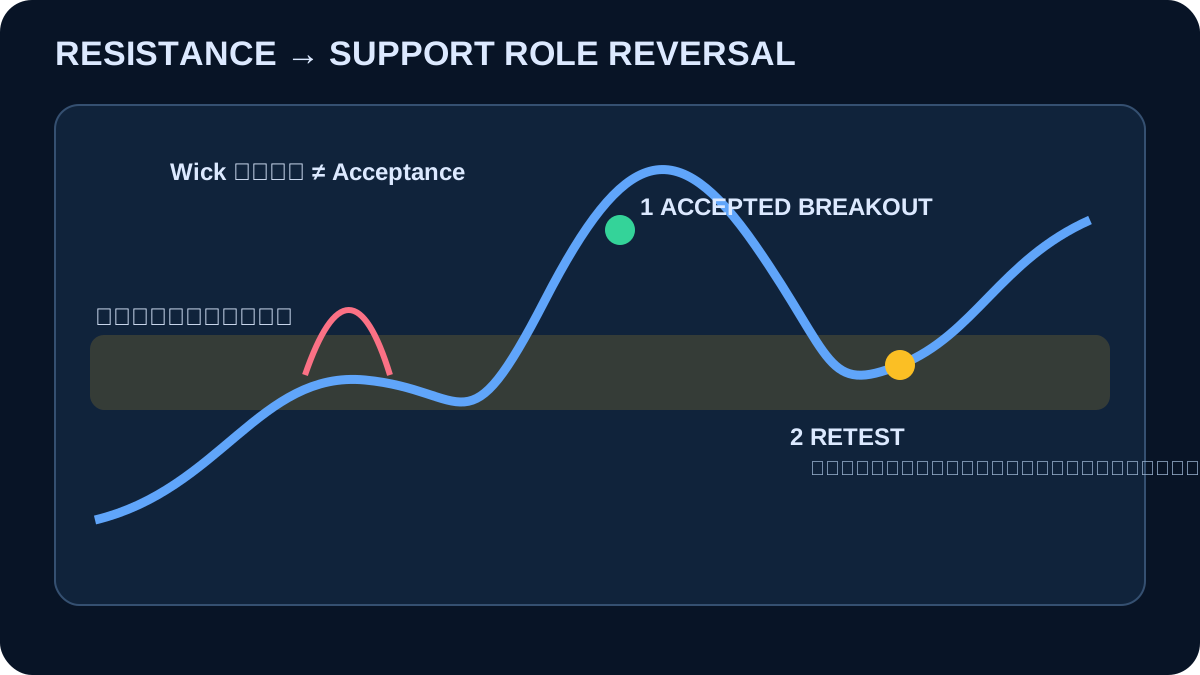
After price closes and accepts above resistance, the former resistance may act as support on a retest. A wick through the zone is not automatically acceptance. Define the required closes and invalidate the flip if price is accepted back through the old zone.
7.2 Candlestick confirmation
Mark the zone before price arrives. Then wait for a closed candle, interpret body and wick, require the chosen confirmation, define invalidation, and size risk. A hammer at predefined support after a decline has different context from the same shape in the middle of a range.
7.3 Decision checklist
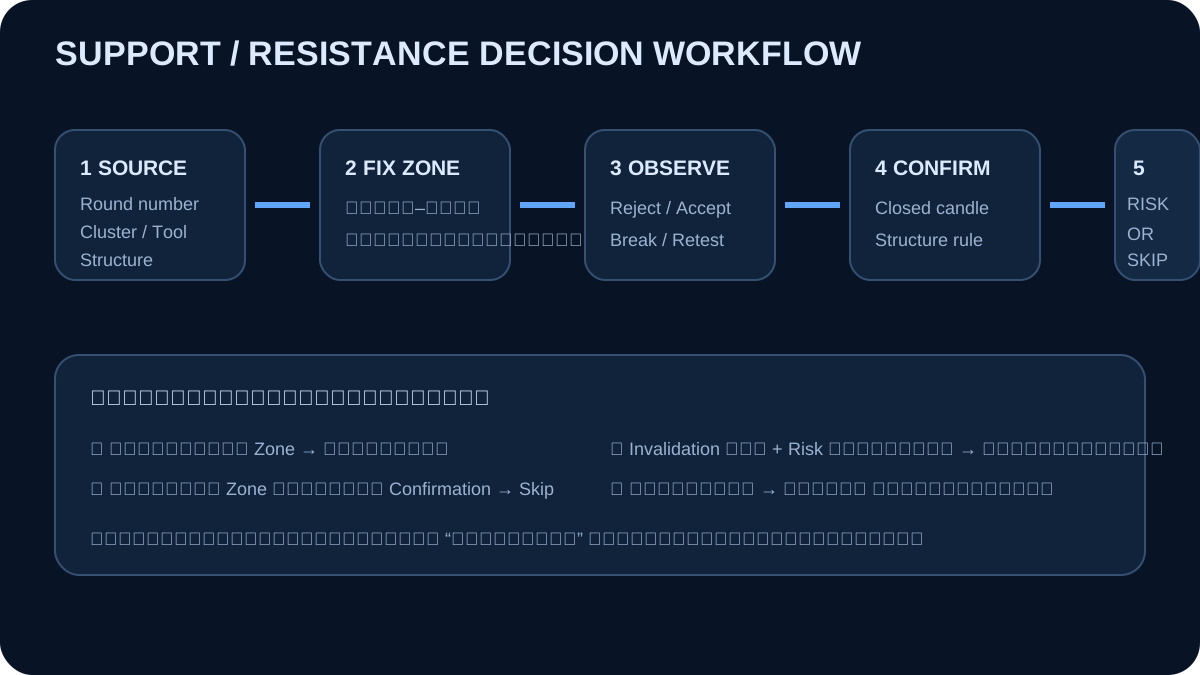
Record the symbol, timeframe, zone source and boundaries, rejection and acceptance rules, confirmation, invalidation, stop distance, size, and costs. Keep wins, losses, entries, and skipped setups. Doing nothing is a valid result when evidence is incomplete.
Lesson audience
Page views by visitors and members
- Total
- —
- Today
- —
- Total
- —
- Today
- —
Statistics will appear after the lesson analytics migration is installed.
Trading Forex and CFDs carries a high level of risk and may not be suitable for all investors. You could lose all of your invested capital. Please study carefully before investing. Content on this site is for education only and does not constitute investment advice.