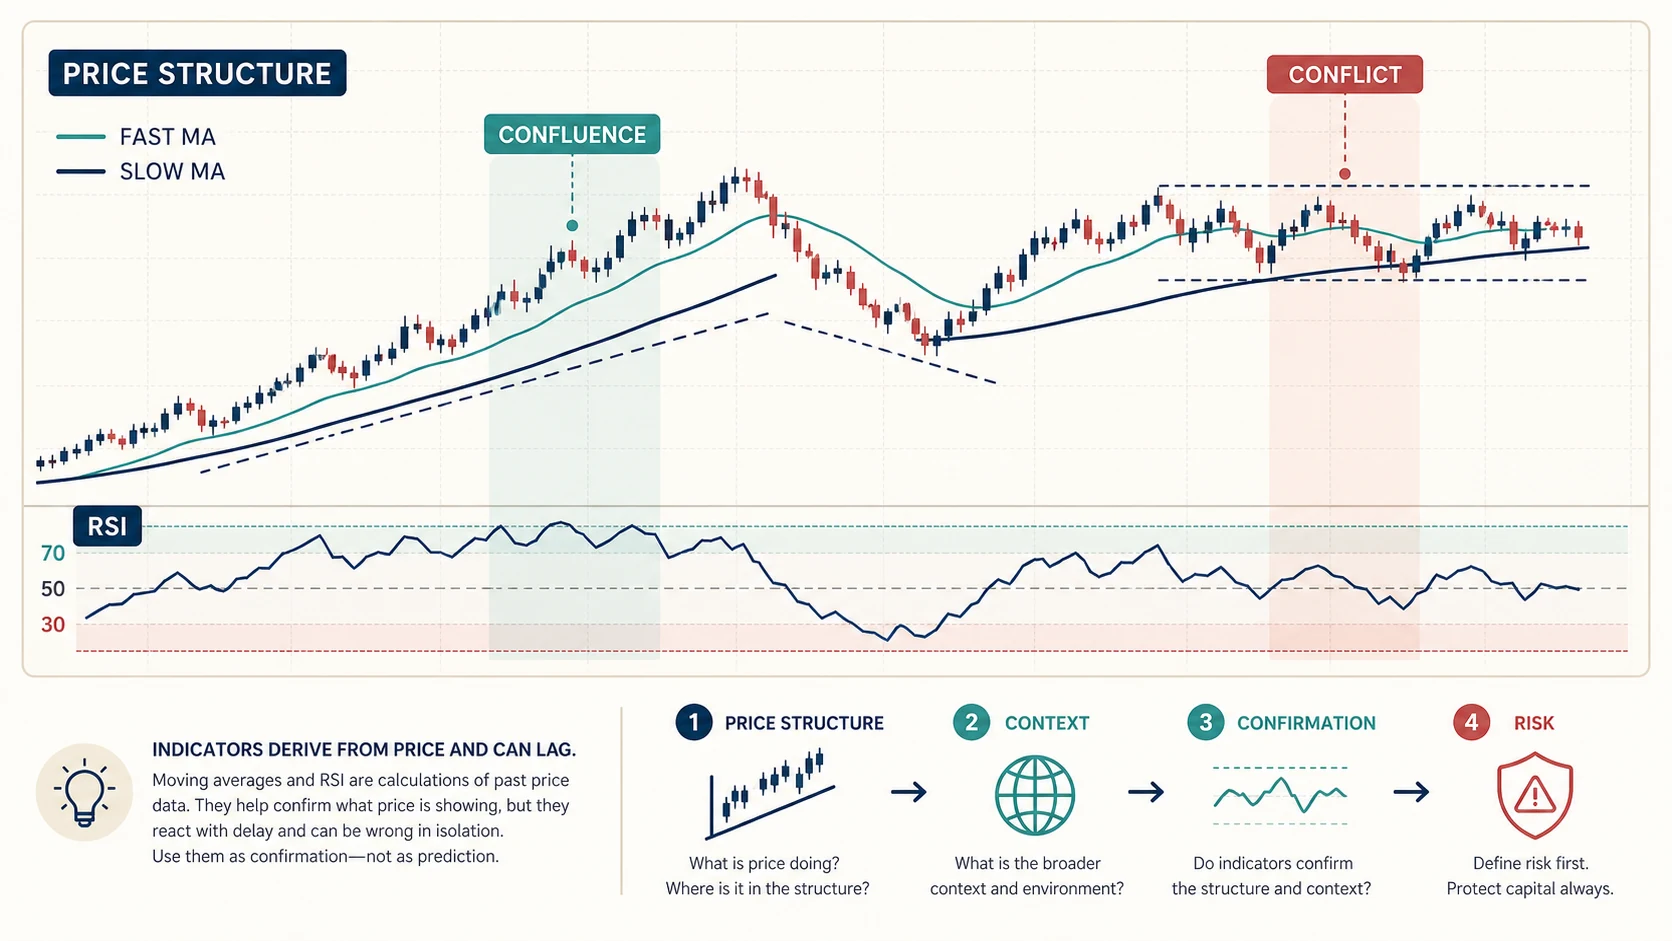
1. Leading and lagging indicators
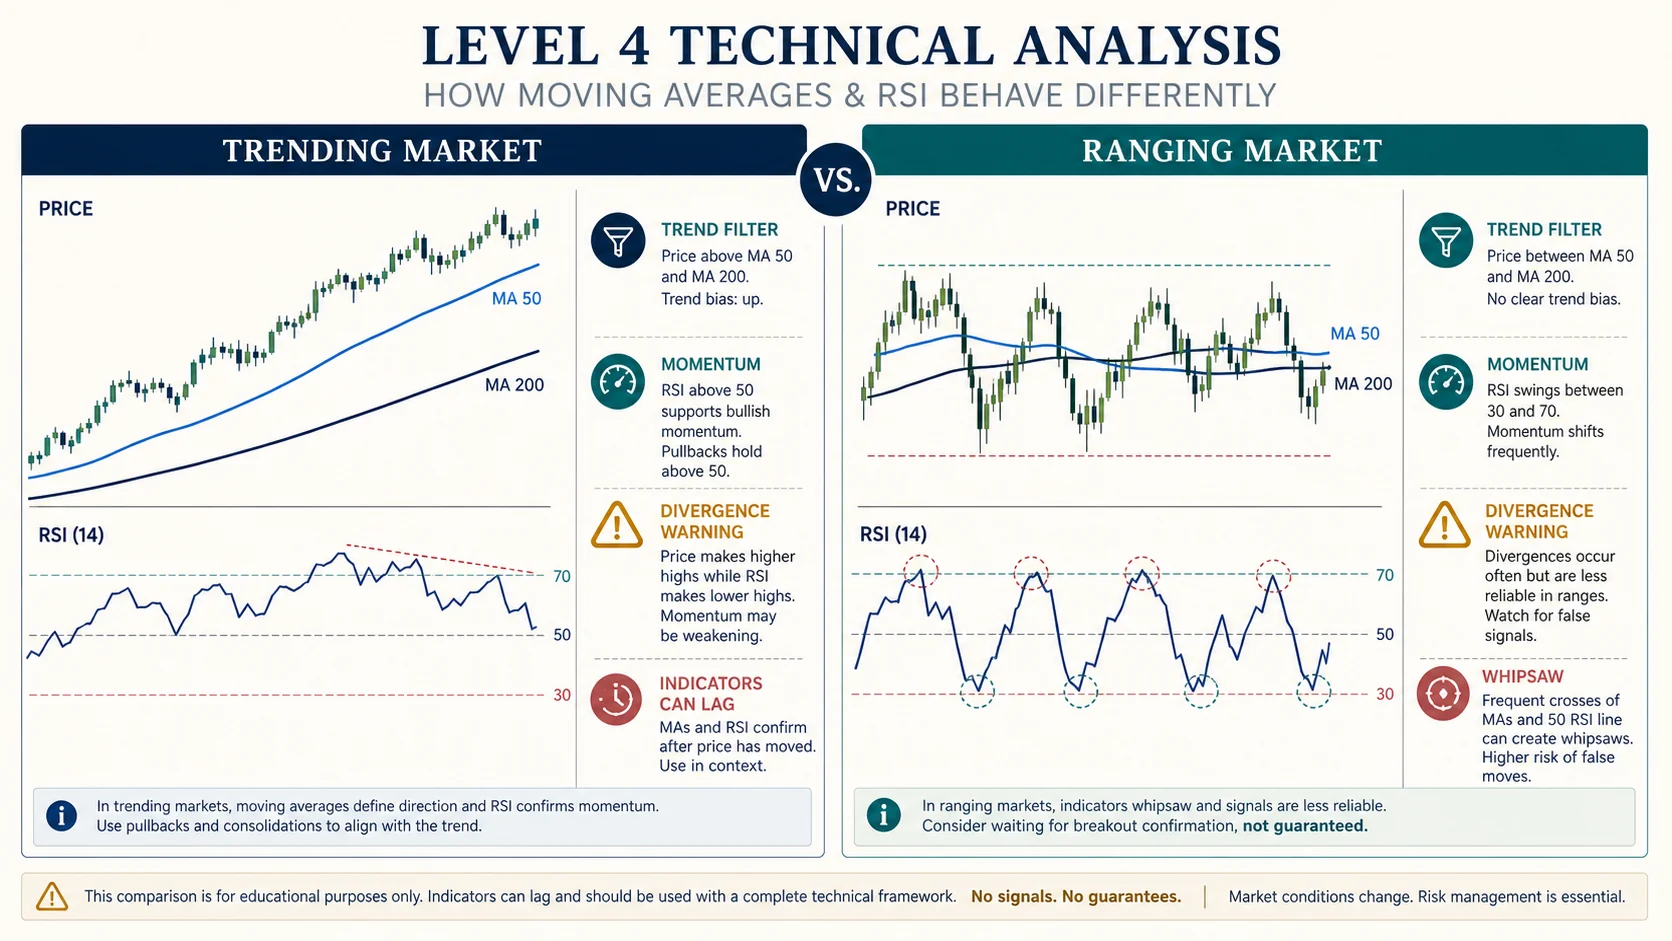
Indicators transform past price, volume, or time into summaries. A leading indicator attempts to flag momentum change before trend confirmation, which makes it responsive but prone to false signals. A lagging indicator confirms price action after it occurs, which is slower but often smoother. Classification depends on use: SMA, EMA, and MACD are commonly trend-following; RSI and Stochastic are commonly leading oscillators; Bollinger Bands and ATR describe volatility; Fibonacci is a swing-projection tool rather than a continuously calculated indicator.
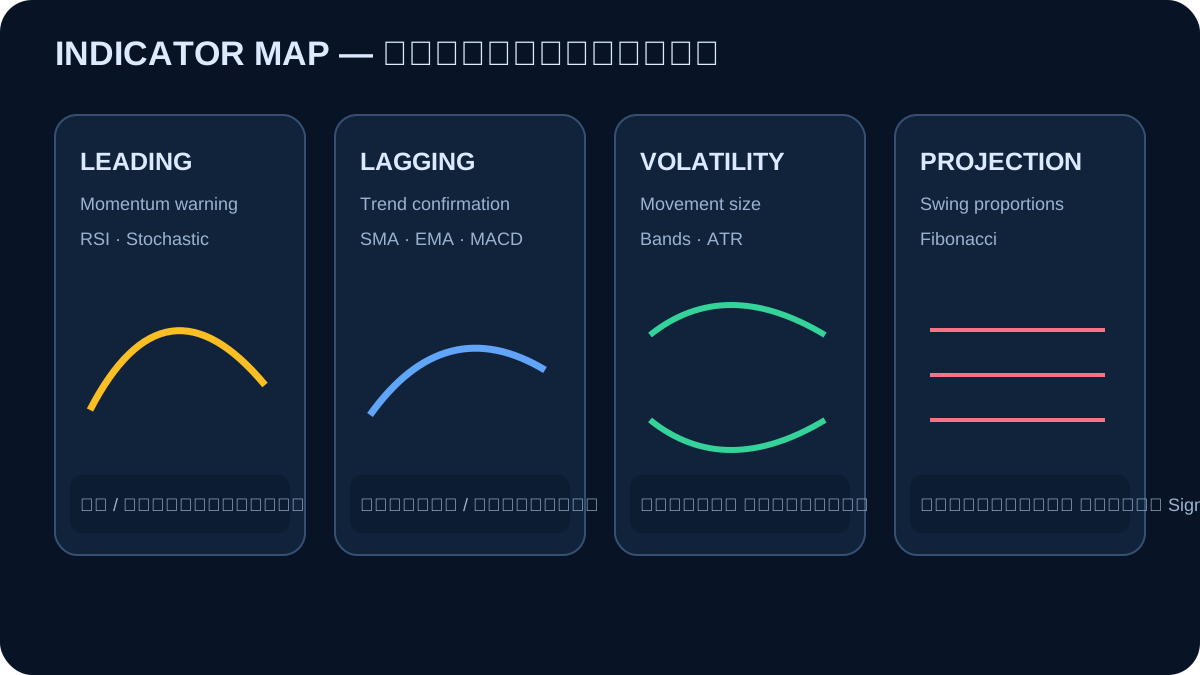
2. SMA — lagging
SMAₜ=(Pₜ+…+Pₜ₋ₙ₊₁)÷n. For closes 100, 102, 101, 104, 108, SMA(5)=103. On a new close of 110, discard 100 and obtain 105. Use slope and price location as a trend filter; expect whipsaws in ranges.
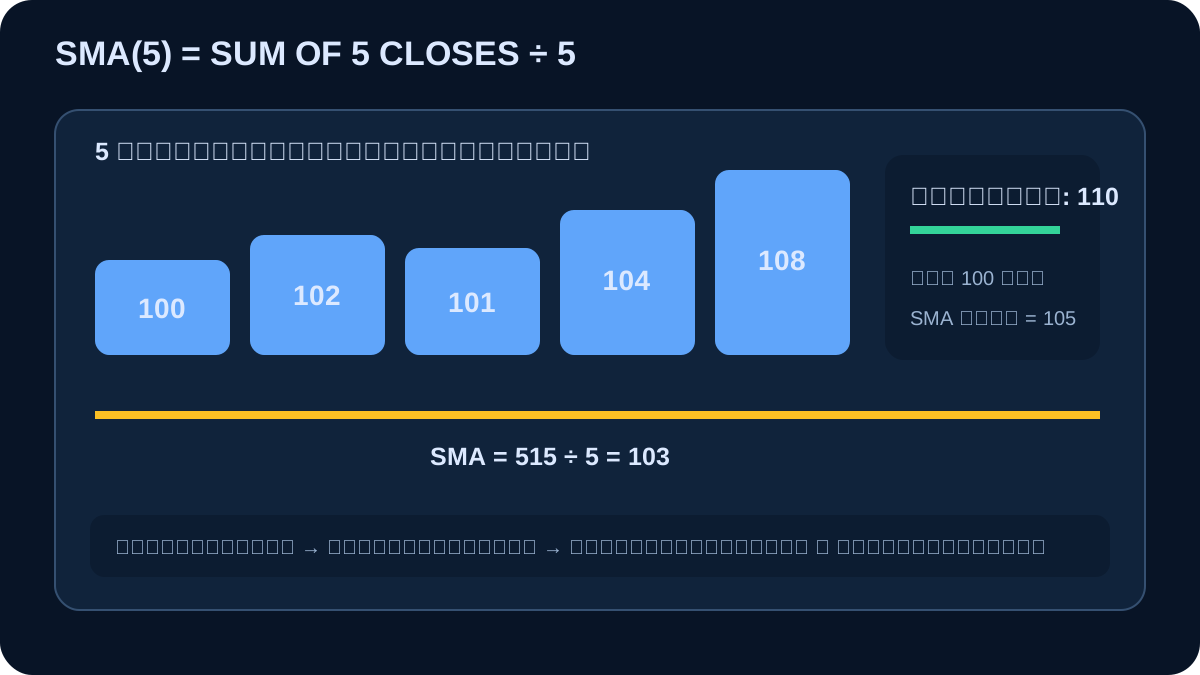
3. EMA — lagging but faster than SMA
EMAₜ=αPₜ+(1−α)EMAₜ₋₁, where α=2÷(n+1). For EMA(5), α=.333; prior EMA 103 and close 110 produce about 105.33. Fast/slow crossovers confirm movement after it happens and can repeatedly whipsaw.
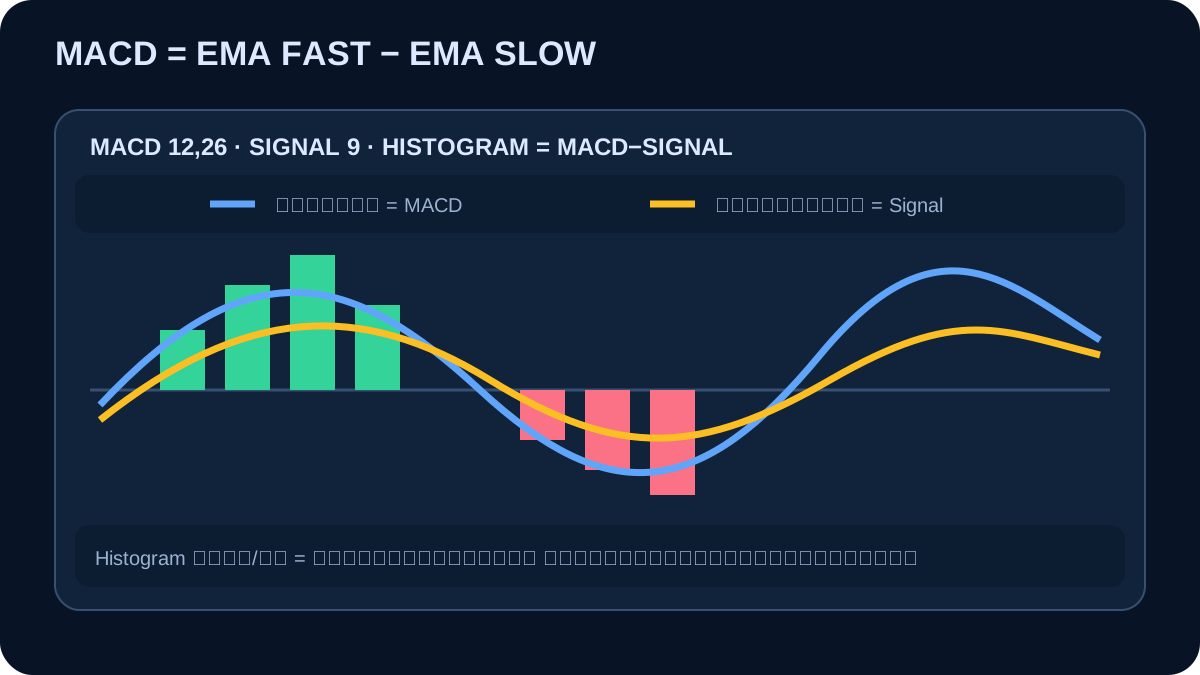
4. MACD — lagging momentum/trend
MACD=fast EMA−slow EMA; Signal is an EMA of MACD; Histogram=MACD−Signal. Standard settings commonly use 12, 26, and 9. MACD and EMA crossovers are not independent evidence because they reuse EMA-derived price data.
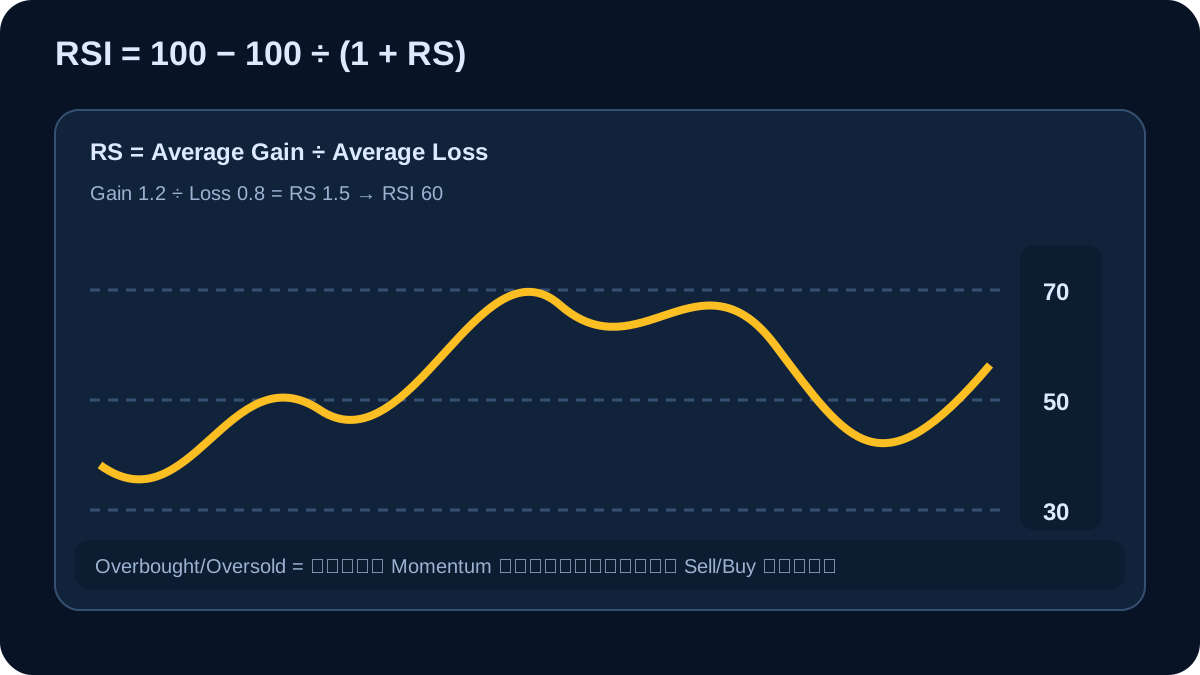
5. RSI — commonly used as a leading oscillator
RS=average gain÷average loss; RSI=100−100÷(1+RS). If gain=1.2 and loss=.8, RSI=60. Levels 70/30 do not force reversal; trends can remain extreme. Divergence is a warning, not an entry.
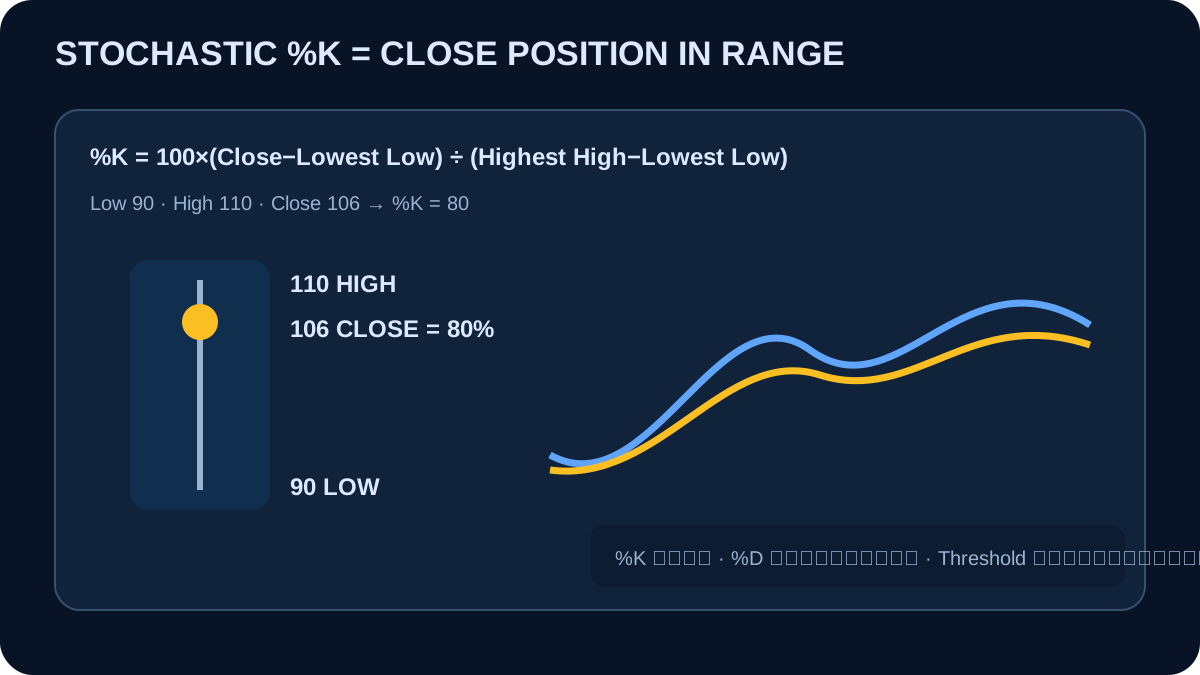
6. Stochastic — commonly used as a leading oscillator
%K=100×(Close−Lowest Low)÷(Highest High−Lowest Low); %D smooths %K. With low 90, high 110 and close 106, %K=80. It measures close location within a range, not cheapness or expensiveness.
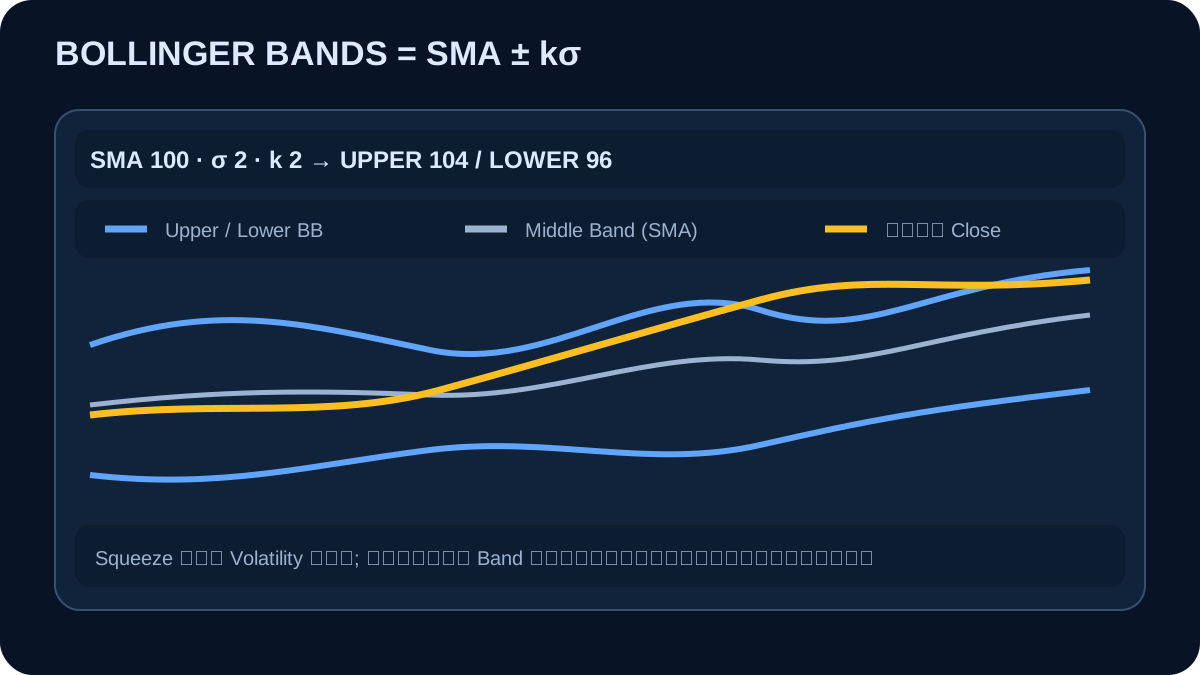
7. Bollinger Bands — descriptive volatility
Middle=SMA(n); Upper=SMA+kσ; Lower=SMA−kσ. If SMA=100, σ=2 and k=2, bands are 104 and 96. Band touches are not automatic reversal signals; trends can walk a band.
8. ATR — lagging/descriptive volatility
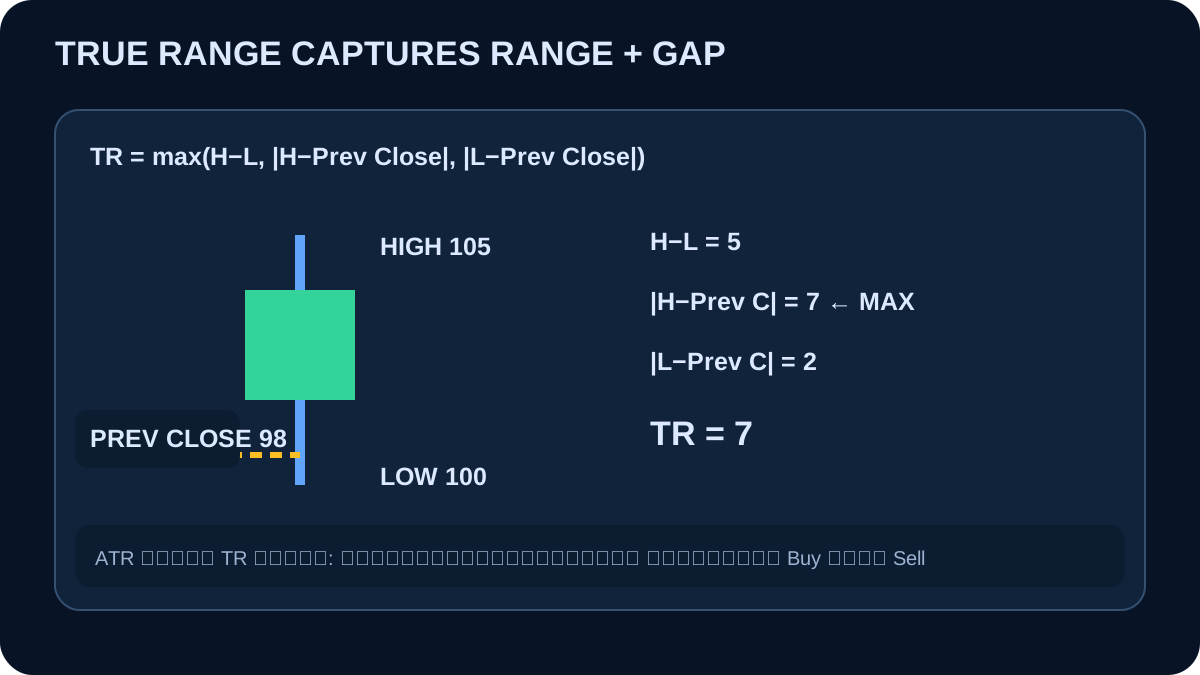
TR=max(H−L, |H−previous close|, |L−previous close|); ATR smooths TR. For H=105, L=100 and previous close=98, TR=7. ATR measures movement size, not direction, and can help normalize buffers or risk.
9. Fibonacci Retracement — projection tool
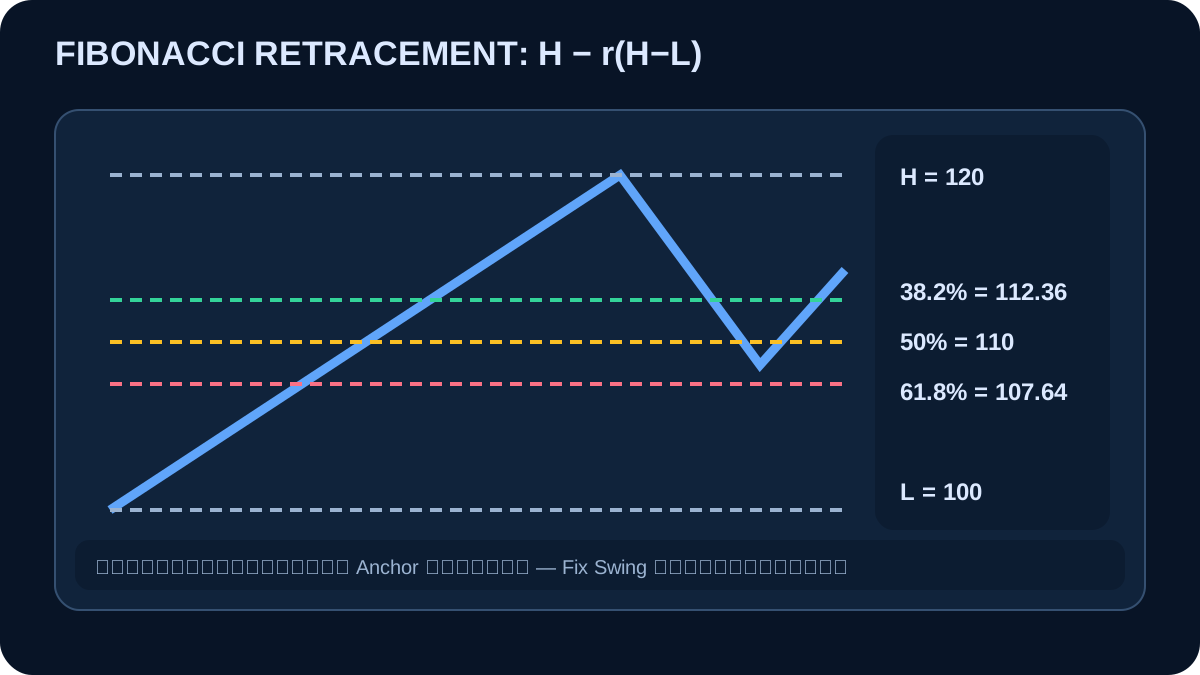
For an upswing L to H, a retracement level is H−r(H−L). With L=100 and H=120, 38.2%=112.36, 50%=110 and 61.8%=107.64. Fix anchor rules beforehand; a touch is not an entry.
10. Selection workflow
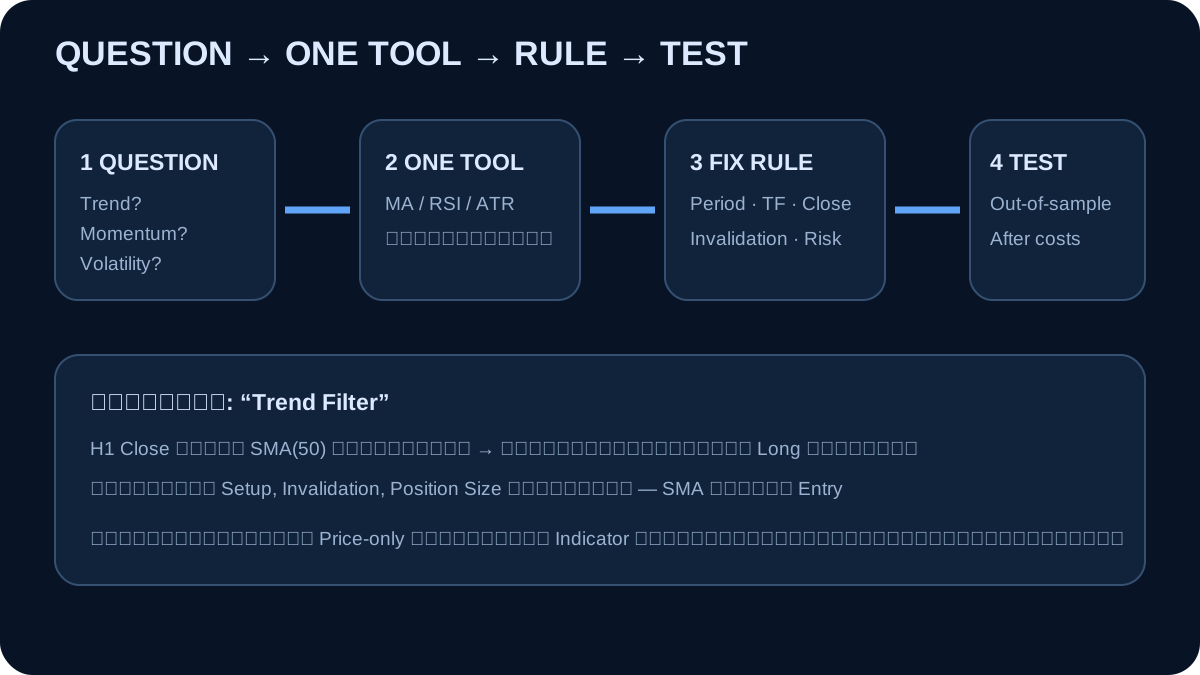
Choose by question: trend, momentum, volatility, or projection. Use one representative per job, specify symbol, timeframe, source, period, closed-bar rule, invalidation, size, and costs, then evaluate out of sample.
Lesson audience
Page views by visitors and members
- Total
- —
- Today
- —
- Total
- —
- Today
- —
Statistics will appear after the lesson analytics migration is installed.
Trading Forex and CFDs carries a high level of risk and may not be suitable for all investors. You could lose all of your invested capital. Please study carefully before investing. Content on this site is for education only and does not constitute investment advice.